


Market Analysis: E-mini S&P 500 Price Drops to Lowest in a Month
FXOpen

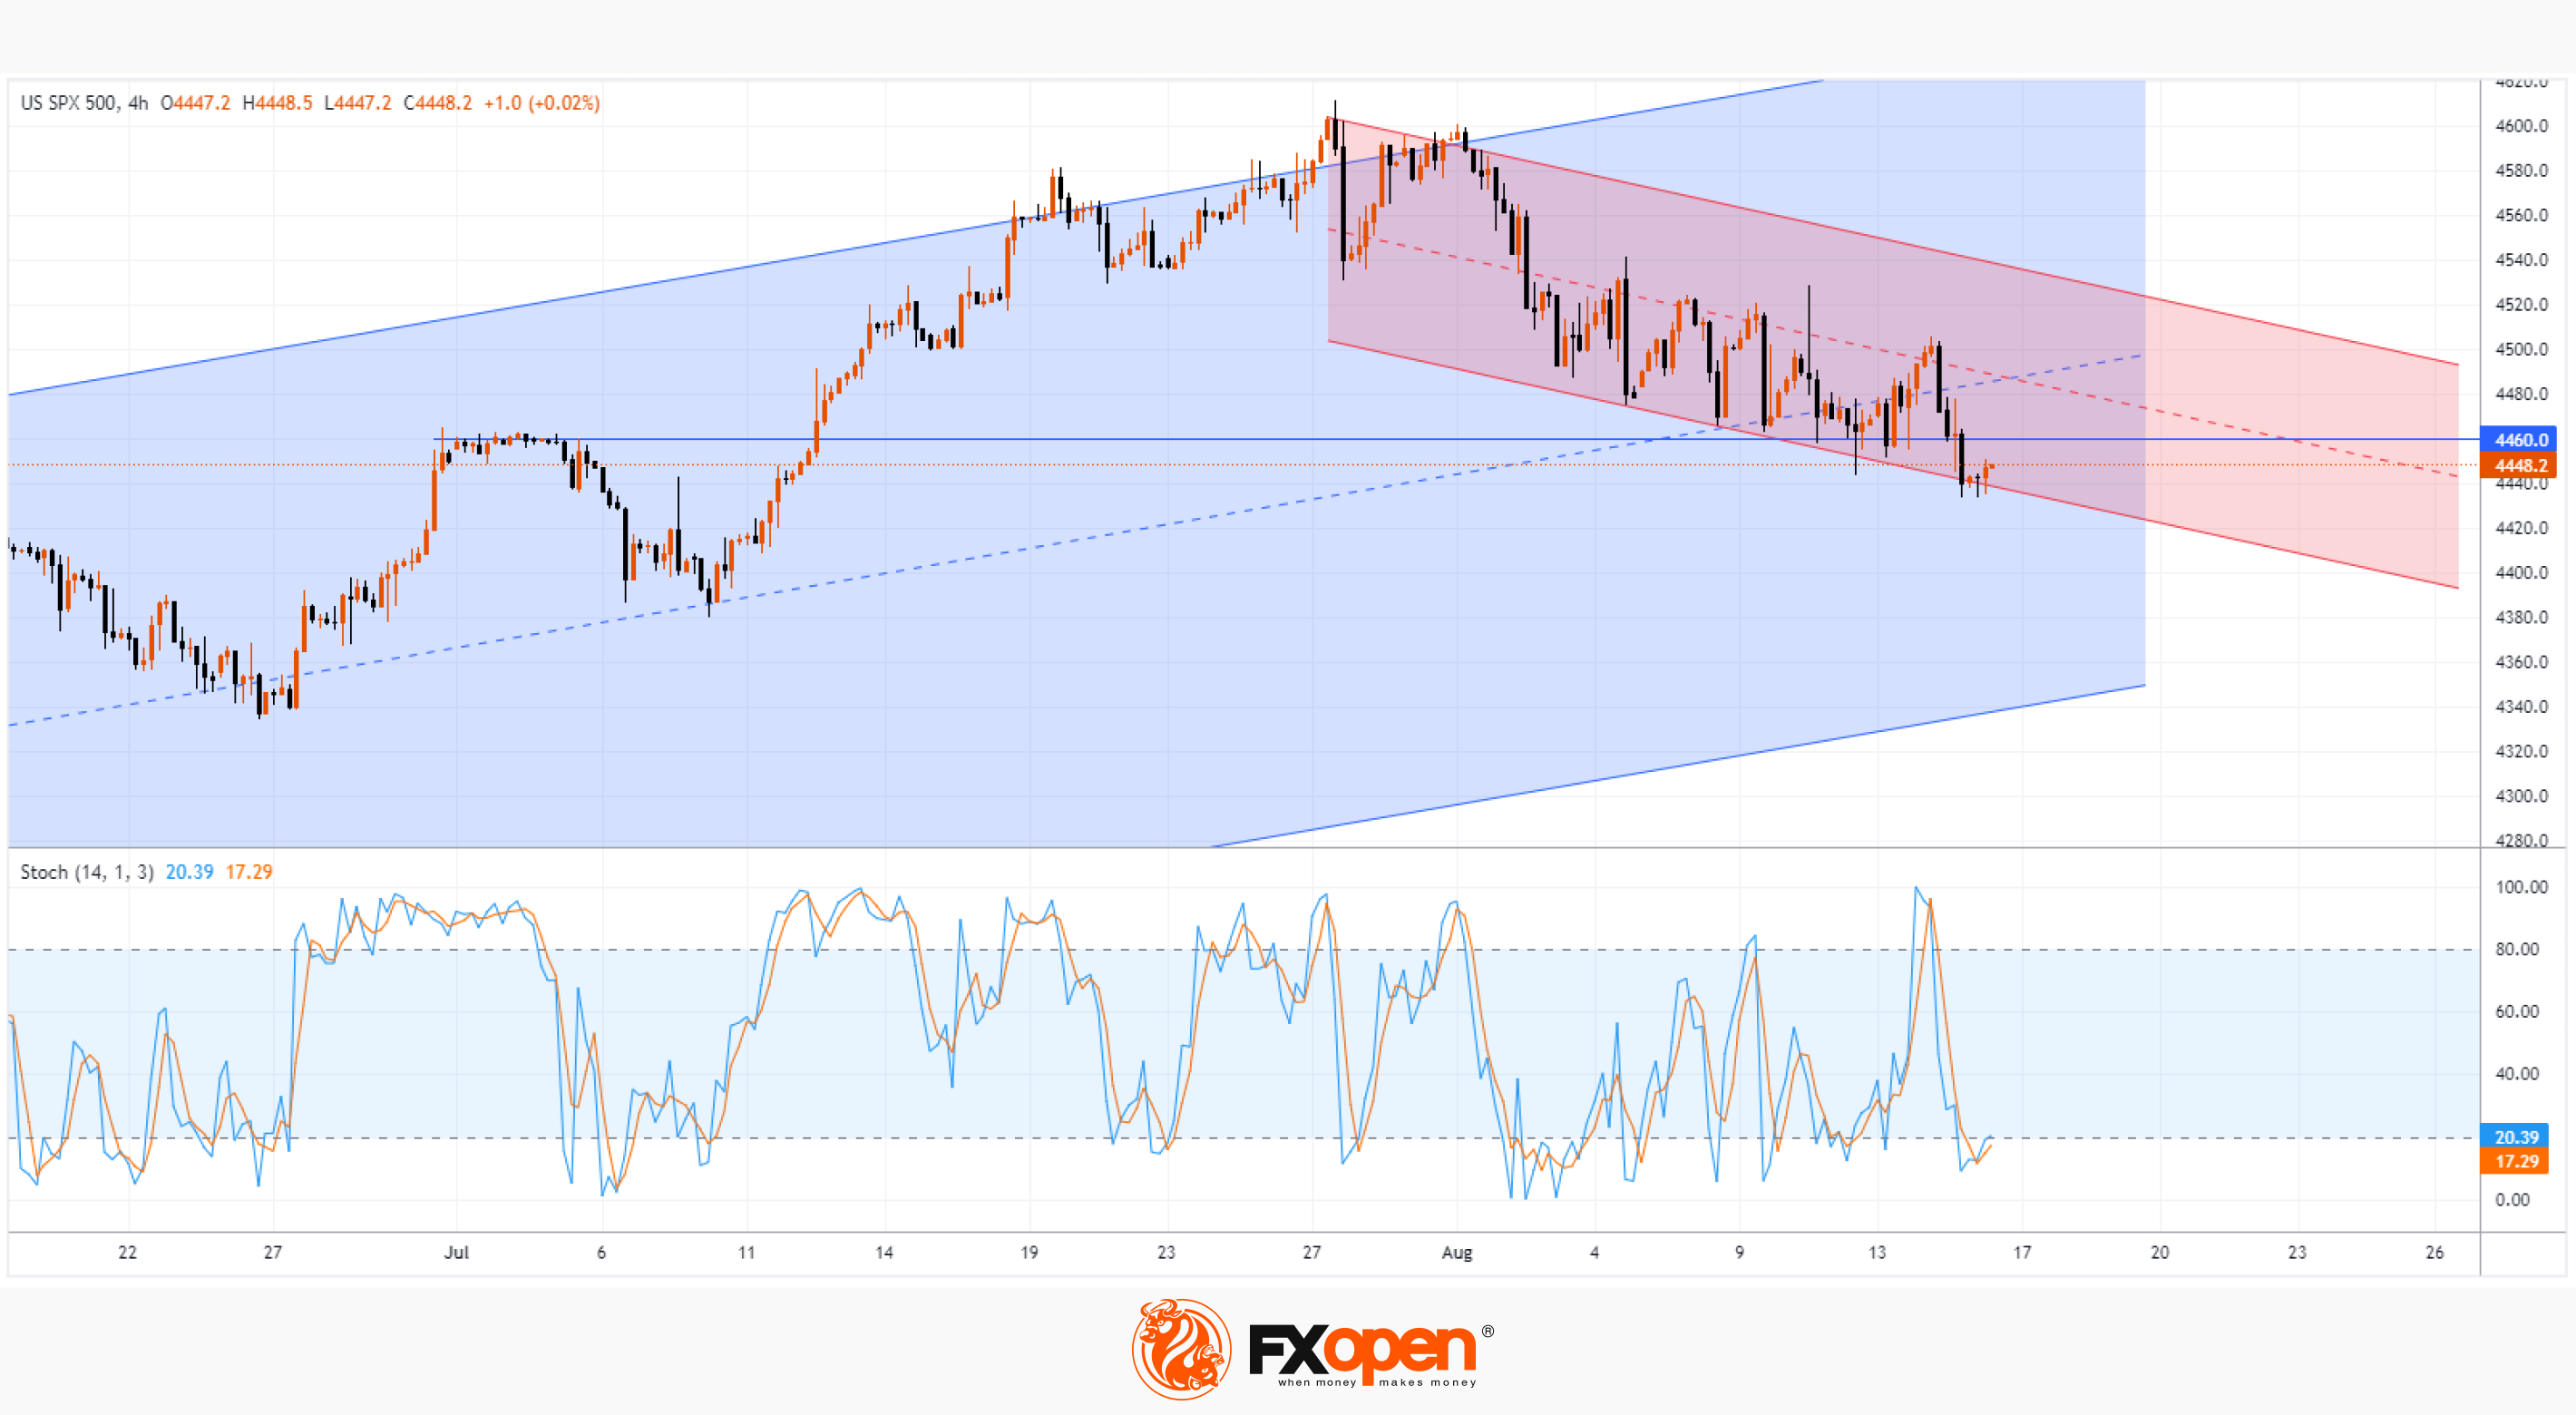
Yesterday, the S&P 500 fell below the 4,440 level — the last time the price of the S&P 500 was this much was on July 12.
The following contributed to the decline in the stock market:
→ strong US retail sales data (actual: +0.7%, expected +0.4%, last month: +0.2%). Market participants fear that interest rates may remain high for longer;
→ information that Fitch may downgrade further.
Thus, the decline amounted to more than 3.5% from the highs of the year recorded at the end of July. Will the decline continue? MarketWatch published the opinion of stock market strategist Hayes Martin: the correction could continue from 8% to 13%. However, the good news is that, according to the strategist, it will not break the current bull market.
Bullish arguments for the 4-hour chart:
→ the price is at the lower border of the descending channel (shown in red), which gives reason to expect a rebound;
→ many technical indicators (for example, stochastic) show oversold conditions;
→ this morning the E-mini S&P 500 did not develop a fall — perhaps yesterday's fears were emotional.
Bearish arguments:
→ the level 4,460 can serve as resistance;
→ the median and upper line of the red channel can also provide resistance.
An important factor that will affect the price of the E-mini S&P 500 will be information from the FOMC (to be published today at 21:00 GMT+3). Bloomberg writes that the topic of discussion at the Fed is changing from "how high should the rate be" to "how long will it be held at a high level." Get ready for spikes in volatility tonight.
Trade global index CFDs with zero commission and tight spreads (additional fees may apply). Open your FXOpen account now or learn more about trading index CFDs with FXOpen.
This article represents the opinion of the Companies operating under the FXOpen brand only. It is not to be construed as an offer, solicitation, or recommendation with respect to products and services provided by the Companies operating under the FXOpen brand, nor is it to be considered financial advice.
Stay ahead of the market!
Subscribe now to our mailing list and receive the latest market news and insights delivered directly to your inbox.


Latest articles

DAX 40: consolidation amid technology sell-off
A wave of selling in the technology sector that emerged earlier this week has weighed on European equities. The trigger was investor concern over the profitability of large-scale debt-funded investments by major US tech companies in AI infrastructure. The Nasdaq

Euro Hits Fresh Yearly Lows Amid Dovish ECB Signals
The euro remains under pressure following weak macroeconomic data from the euro area and fresh signals that the European Central Bank is prepared to maintain a more accommodative monetary policy stance. Data released yesterday pointed to a deterioration in business

Pound at Key Levels: Markets Assess Impact of Political Uncertainty in the UK
The British pound remains under pressure following increased political uncertainty in the United Kingdom triggered by the Prime Minister’s resignation. Investors are assessing potential shifts in the political and economic policy outlook after the head of government stepped down,