


Market Analysis: E-mini S&P 500 Up about 6% Since the Beginning of the Month
FXOpen
Worries about a banking crisis and a recession amid high inflation seem to be a thing of the past. This week, the E-mini S&P 500 returned to its March 2022 levels, having recouped all the losses since the Fed's first rate hike.
According to UBS analysts, the current growth of indices in the stock market is associated with “inflation of greed”. That is, under the guise of rising costs, companies are increasingly raising prices for goods and services, seeking to increase earnings. This increases the profitability of their business and leads to an increase in the value of the shares.
According to FactSet, the latest reporting season was the highest actual performance in 2 years compared to analysts' expectations, with almost 80% of companies reporting first-quarter earnings beat expectations.
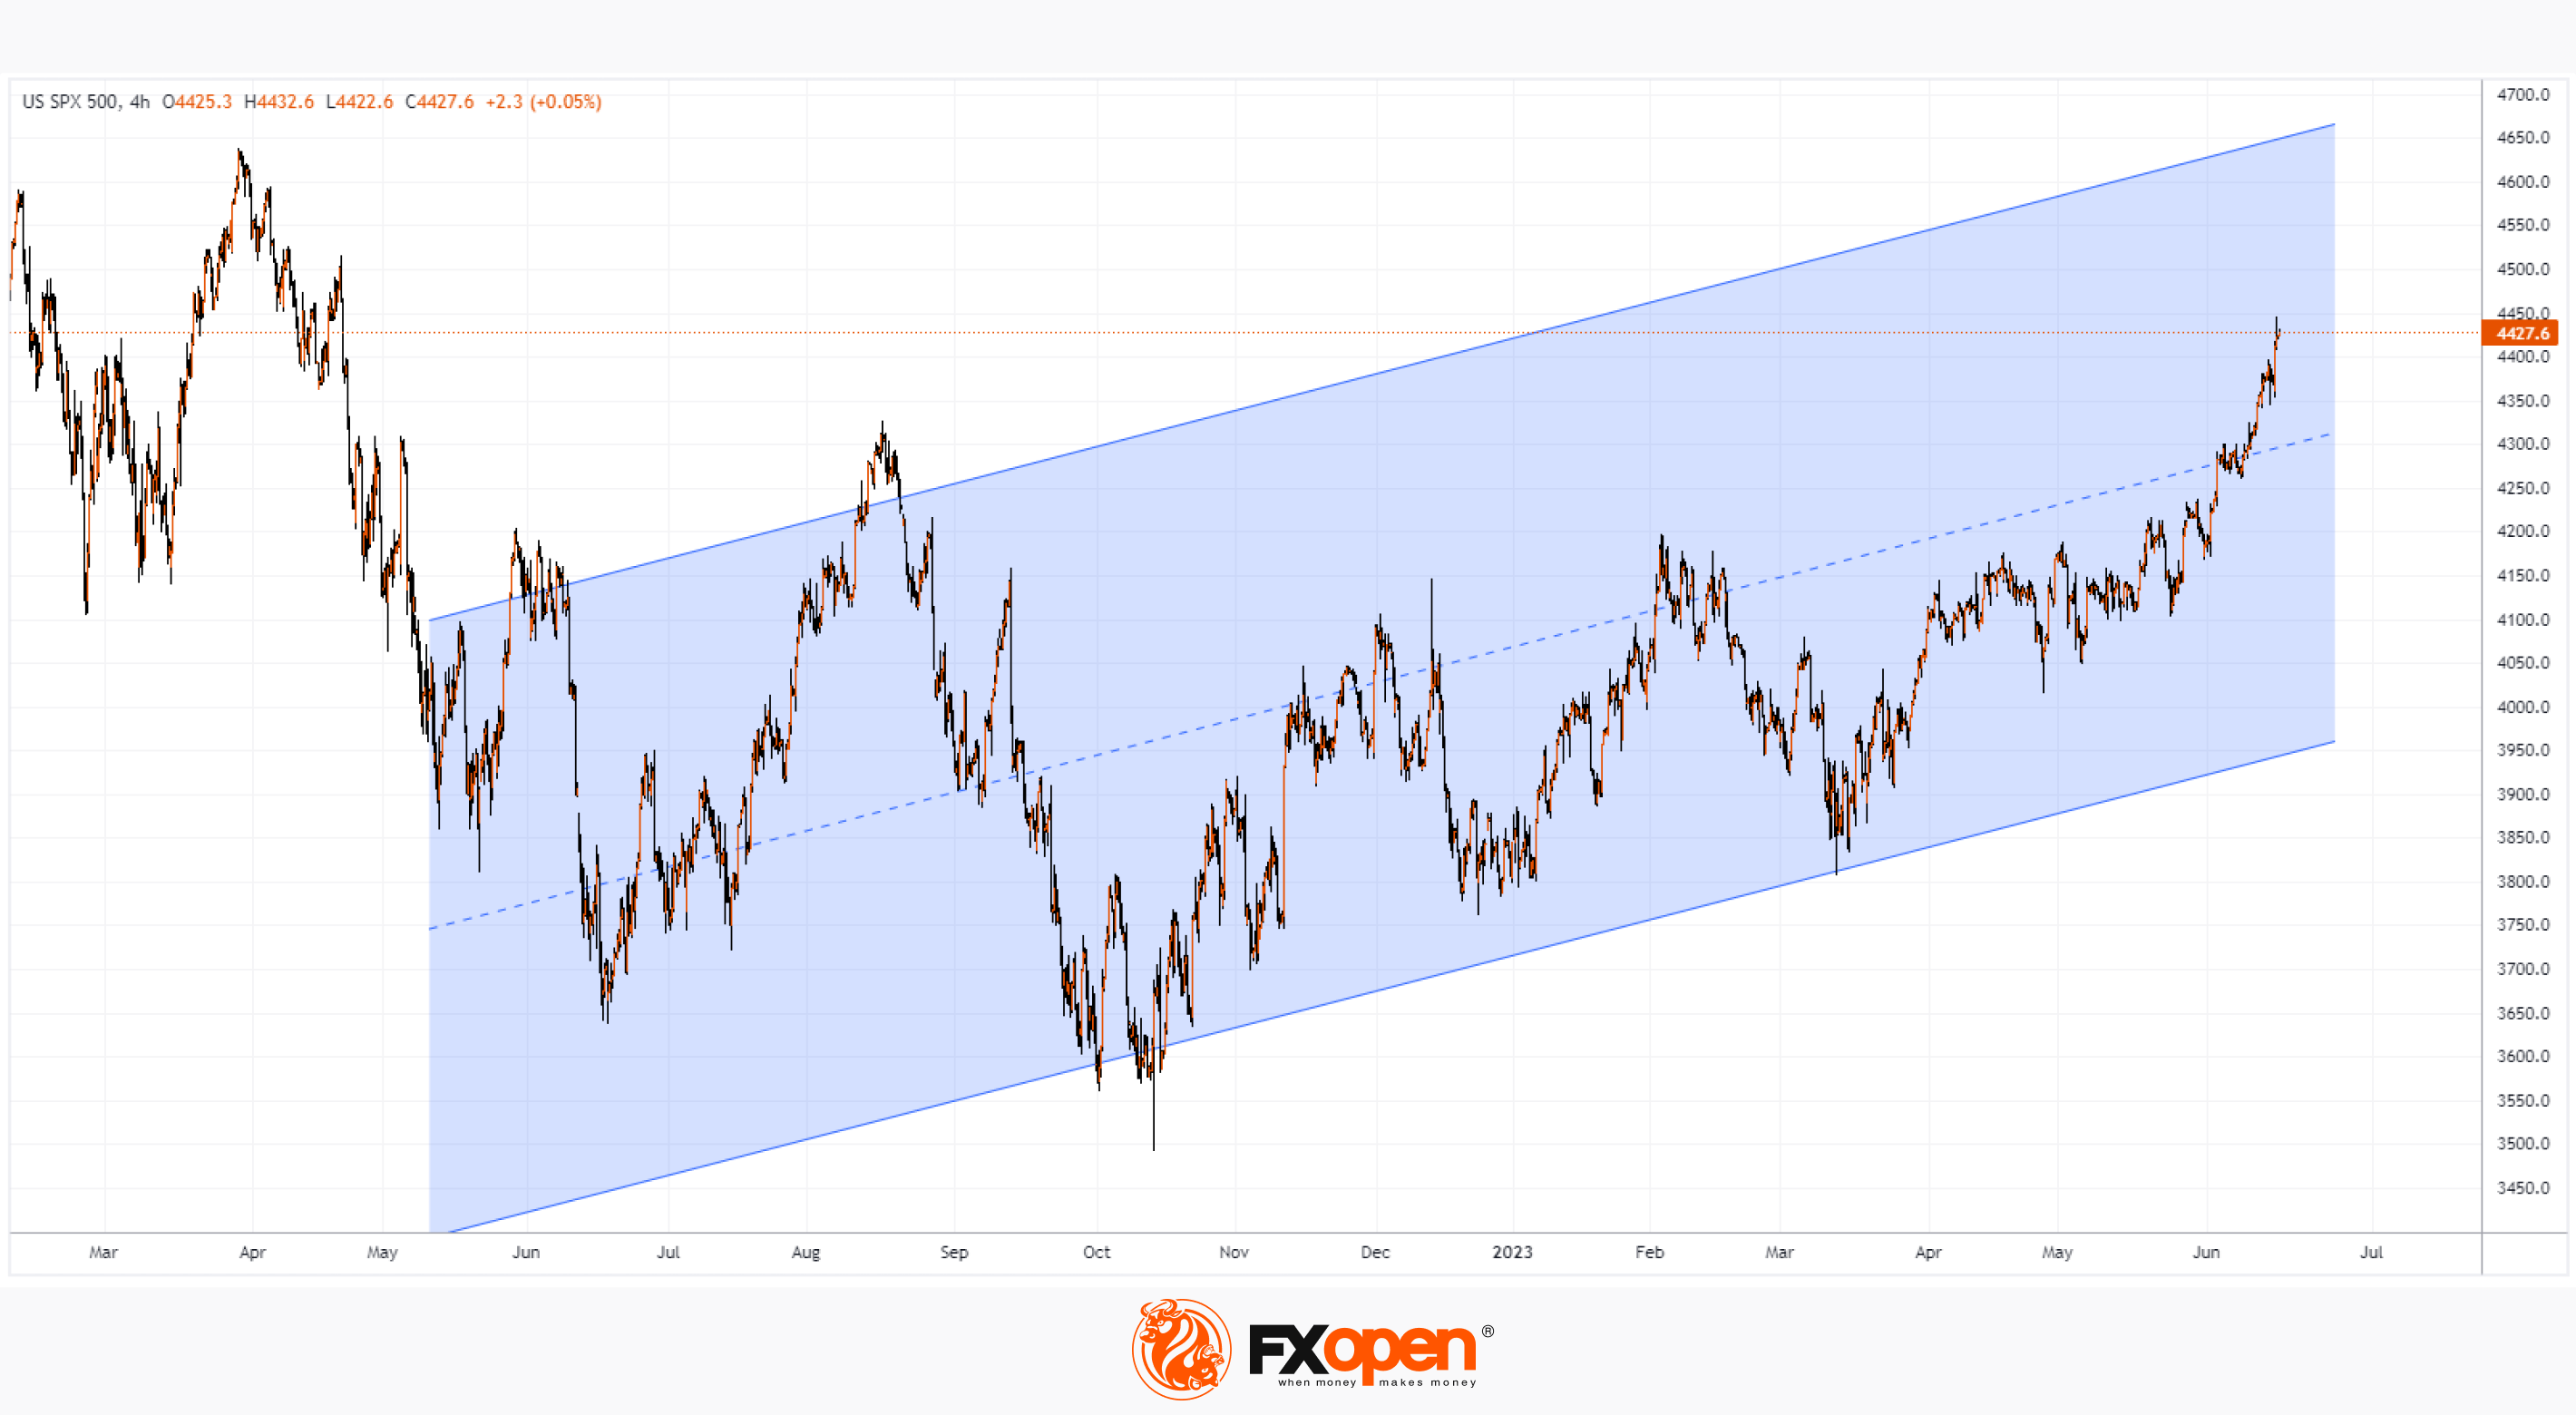
The E-mini S&P 500 chart shows the index rising within an ascending channel (shown in blue) that begins in 2022. A week of important news led to a bullish breakout of an important top of last summer, which opens up the prospect of growth to the upper border of the mentioned channel.
Trade global index CFDs with zero commission and tight spreads (additional fees may apply). Open your FXOpen account now or learn more about trading index CFDs with FXOpen.
This article represents the opinion of the Companies operating under the FXOpen brand only. It is not to be construed as an offer, solicitation, or recommendation with respect to products and services provided by the Companies operating under the FXOpen brand, nor is it to be considered financial advice.
Stay ahead of the market!
Subscribe now to our mailing list and receive the latest market news and insights delivered directly to your inbox.


Latest articles

EUR/USD Eyes Gains As USD/CHF Weakness Deepens Again
EUR/USD started a fresh increase above 1.1700 and 1.1720. USD/CHF declined further and is now struggling below 0.7835.
Important Takeaways for EUR/USD and USD/CHF Analysis Today
· The Euro started a decent increase from

Apple: Earnings Day Above the Activity Zone
On 30 April, after the market close, Apple Inc. will release its financial results for the second quarter of fiscal 2026. The consensus forecast, based on estimates from 31 analysts, points to revenue of around $109.7 billion, with expected

USD/JPY and USD/CHF Near Key Levels: The Dollar Supported by the Fed
The US dollar continues to trend upwards following the Federal Reserve meeting, drawing support from the regulator’s moderately hawkish stance and comments by Jerome Powell. Markets interpret the Fed’s rhetoric as a signal that restrictive policy is likely