


FXOpen

The EUR/USD chart indicates an interesting situation from the point of view of technical analysis, namely, a “nested” head-and-shoulders pattern.
The global bearish SHS pattern is formed by the peaks of February, April, June.
The local bearish SHS pattern is formed by three peaks formed in the second half of June. This should give confidence to the bears, who have statistics that indicate the effectiveness of the pattern.
Please note that inflation data will be published today:
→ 12:00 GMT+3: Core CPI Flash Estimate.
→ 12:00 GMT+3: US Core CPE is an indicator that the Fed pays special attention to.
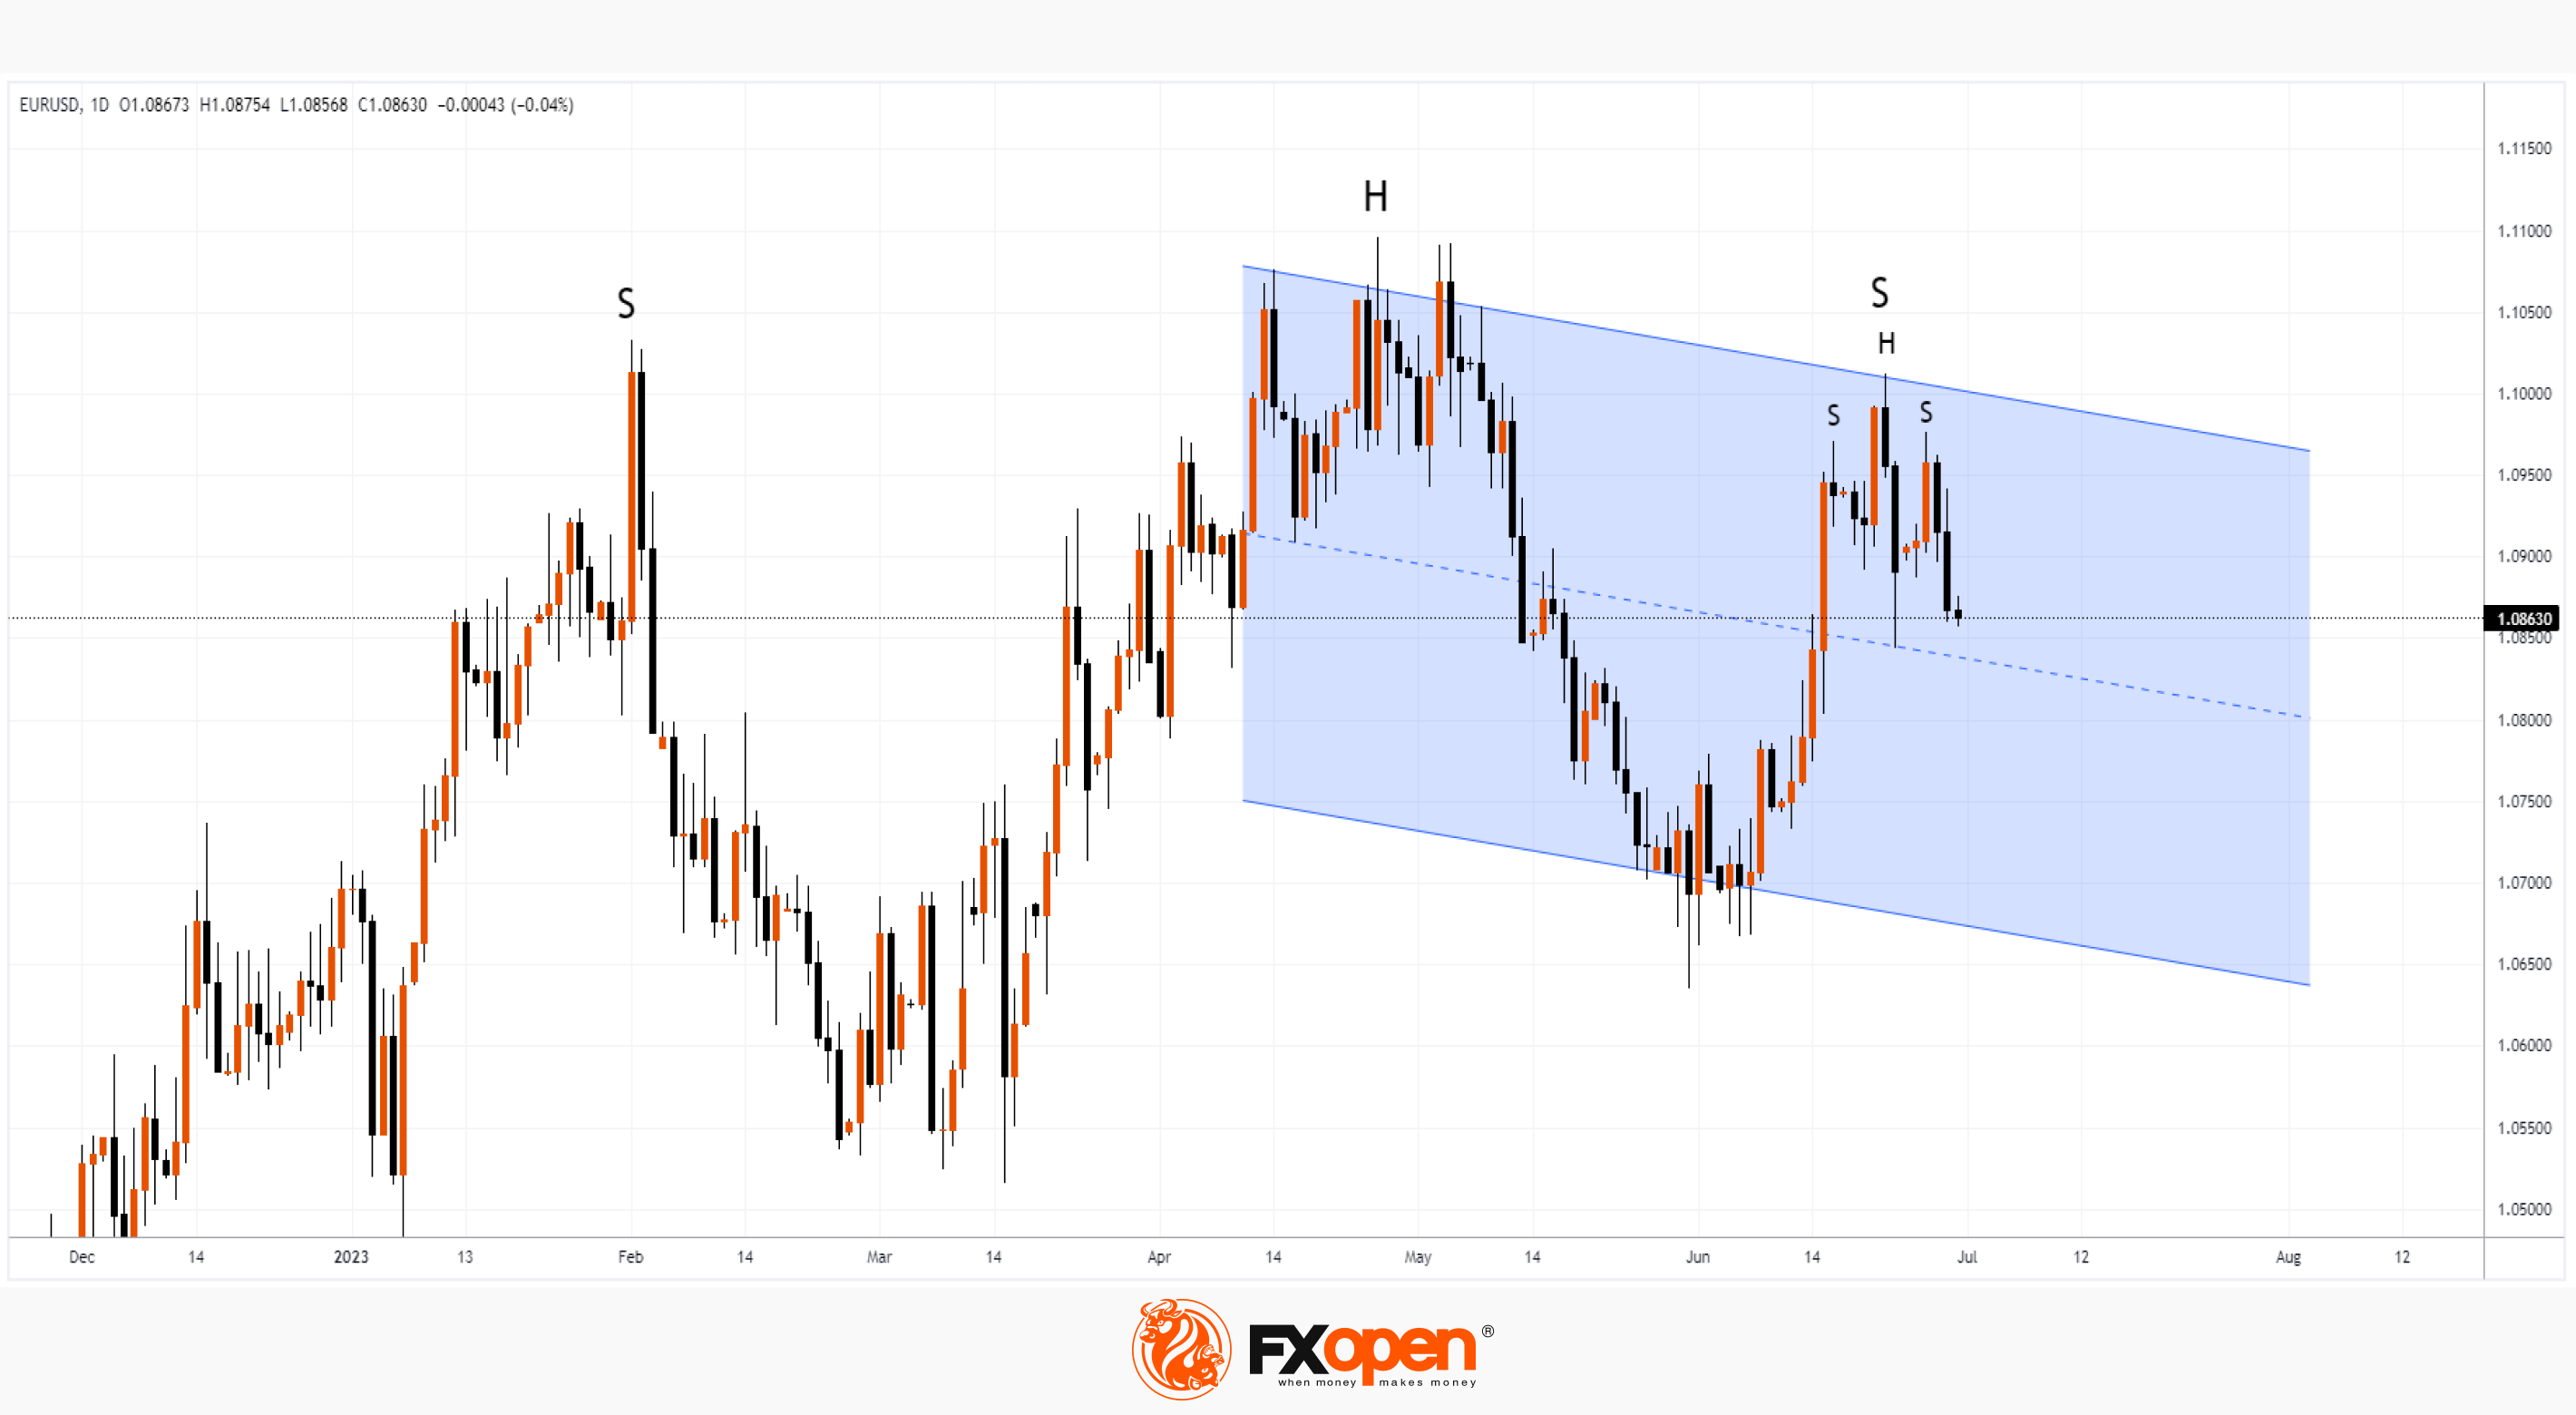
Earlier this week, both Lagarde and Powell reaffirmed their resolve to fight inflation. The release of news today can provoke sharp movements in the market — for example, a breakdown of the neck line of the local SHS pattern. Get ready for bursts of volatility.
Trade over 50 forex markets 24 hours a day with FXOpen. Take advantage of low commissions, deep liquidity, and spreads from 0.0 pips (additional fees may apply). Open your FXOpen account now or learn more about trading forex with FXOpen.
This article represents the opinion of the Companies operating under the FXOpen brand only. It is not to be construed as an offer, solicitation, or recommendation with respect to products and services provided by the Companies operating under the FXOpen brand, nor is it to be considered financial advice.
Stay ahead of the market!
Subscribe now to our mailing list and receive the latest market news and insights delivered directly to your inbox.


Latest articles

Consolidation Ahead of NFP: Commodity Currencies Search for Direction
Commodity-linked currencies have entered a consolidation phase following recent directional moves, as market participants adopt a wait-and-see approach ahead of key US labour market data. Current price action reflects a balance between ongoing demand for the US dollar and attempts

The Real Driver Behind the Dollar Rally: Market Insights with Gary Thomson
The US dollar has been firm, but the drivers behind the move may be more complex than they first appear.
While geopolitical tension and shifts in risk sentiment play a role, current price behaviour seems increasingly influenced by inflation expectations

EUR/USD and USD/CHF Pull Back: Market Reacts to Fundamentals
European currencies have shown a recovery in recent trading sessions after their recent decline, displaying early signs of a reversal. The US dollar is weakening amid expectations surrounding upcoming US macroeconomic data, while market participants are reassessing their short-term positions