


FXOpen
During the first 3 days of this week, the price of EURO STOXX 50 (SX5E) has fallen by more than 3%.
This was facilitated by:
→ lower oil prices on the eve of the OPEC+ meeting scheduled for June 4. The Saudi oil minister urged market speculators to "be careful”;
→ uncertainty about the US debt ceiling. While a deal has been tentatively reached, it has yet to be officially approved by the Senate. There are only a few hours left;
→ reduced shares of European companies producing luxury goods due to falling demand;
→ disappointing data from China (we wrote about it yesterday), with which Europe is actively trading.
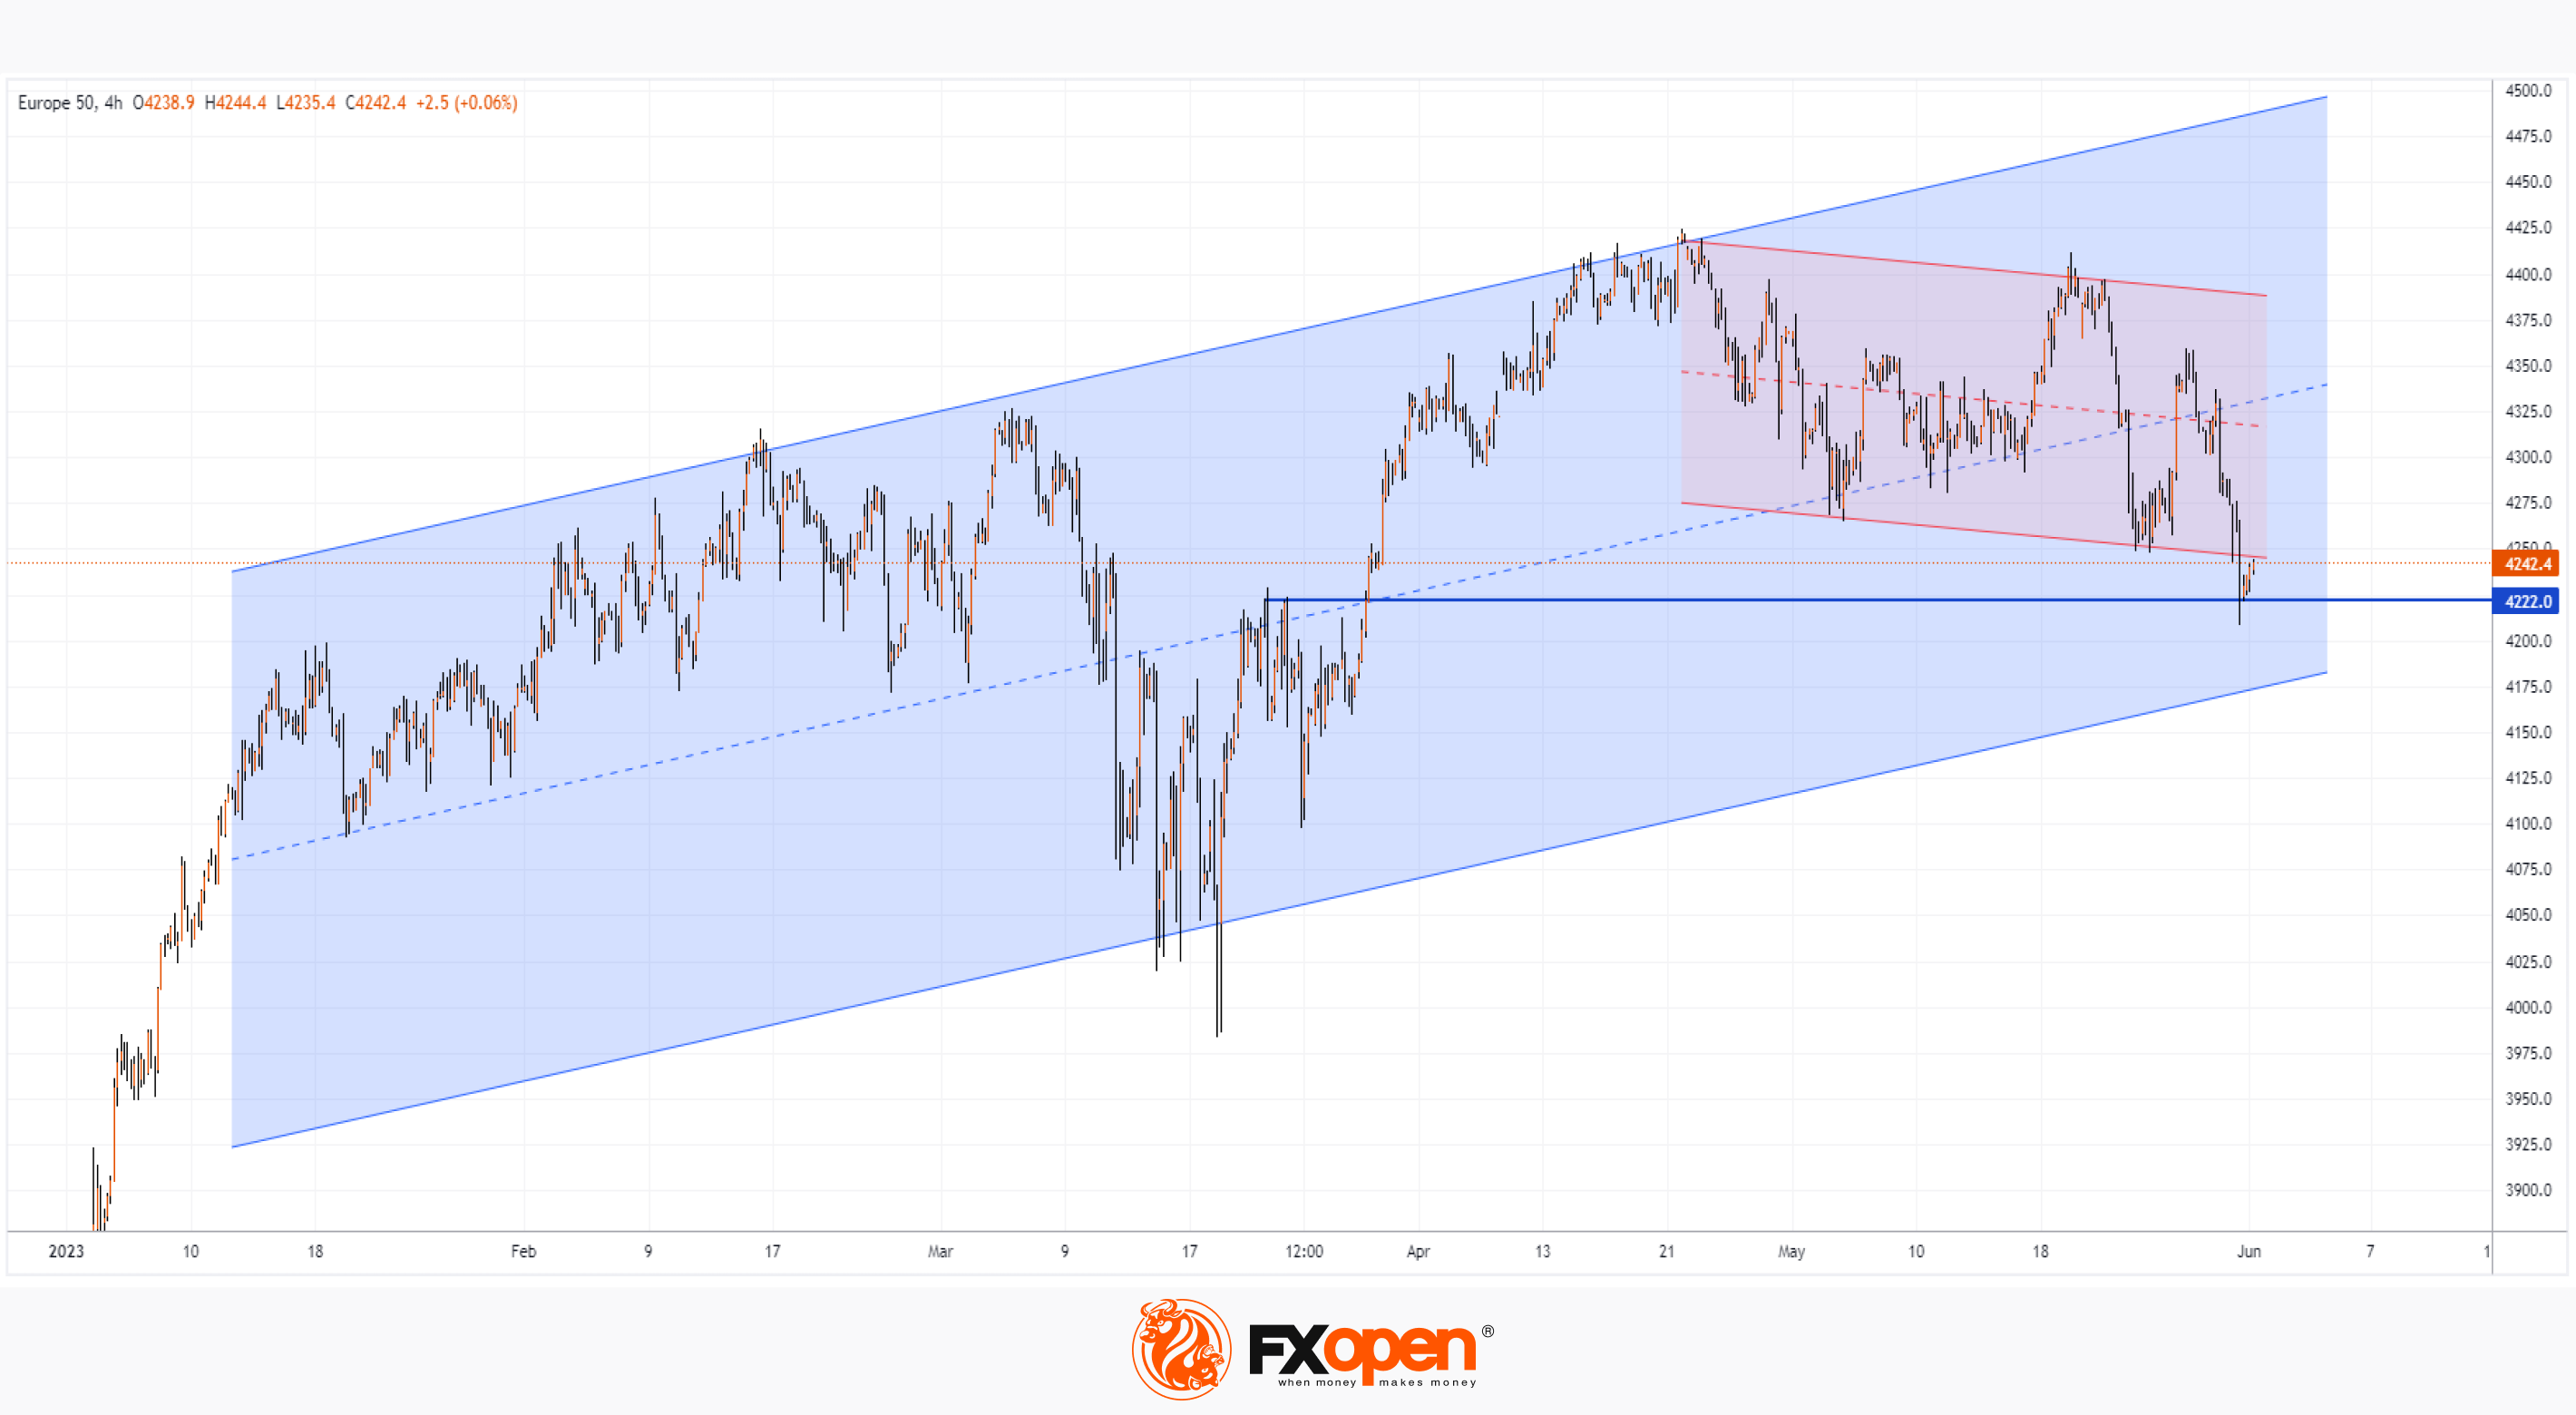
After conducting a technical analysis of the EURO STOXX 50 chart, we can assume that the decline may slow down, because:
→ SX5E price action shows that the 4,222 level, which served as an important resistance in March, now seems to be working as support;
→ support can also be provided by the lower line of the local downlink (shown in red).
→ the lower line of the long-term ascending channel (shown in blue) can give confidence to the bulls.
Trade global index CFDs with zero commission and tight spreads (additional fees may apply). Open your FXOpen account now or learn more about trading index CFDs with FXOpen.
This article represents the opinion of the Companies operating under the FXOpen brand only. It is not to be construed as an offer, solicitation, or recommendation with respect to products and services provided by the Companies operating under the FXOpen brand, nor is it to be considered financial advice.
Stay ahead of the market!
Subscribe now to our mailing list and receive the latest market news and insights delivered directly to your inbox.


Latest articles

Consolidation Ahead of NFP: Commodity Currencies Search for Direction
Commodity-linked currencies have entered a consolidation phase following recent directional moves, as market participants adopt a wait-and-see approach ahead of key US labour market data. Current price action reflects a balance between ongoing demand for the US dollar and attempts

The Real Driver Behind the Dollar Rally: Market Insights with Gary Thomson
The US dollar has been firm, but the drivers behind the move may be more complex than they first appear.
While geopolitical tension and shifts in risk sentiment play a role, current price behaviour seems increasingly influenced by inflation expectations

EUR/USD and USD/CHF Pull Back: Market Reacts to Fundamentals
European currencies have shown a recovery in recent trading sessions after their recent decline, displaying early signs of a reversal. The US dollar is weakening amid expectations surrounding upcoming US macroeconomic data, while market participants are reassessing their short-term positions