


Market Analysis: European Shares Rise on Improving PMI Readings
FXOpen

Yesterday, the values of the PMI index (it is characterized as a leading indicator of industrial production and services) for European countries were published:
→ in Germany: fact = 42.3; expected = 41.1; a month earlier = 40.7;
→ in France: fact = 42.6; expected = 43.2; a month earlier = 42.6;
Although the index values are below 50, indicating a contraction in the economy, the dynamics are encouraging. Thus, in France, the index stabilized after a series of declines. And in Germany, the index is consistently growing after a minimum of 38.8 in July. In this way, business is reacting to the fact that the ECB may have reached the peak of increases and monetary policy will not tighten in the future.
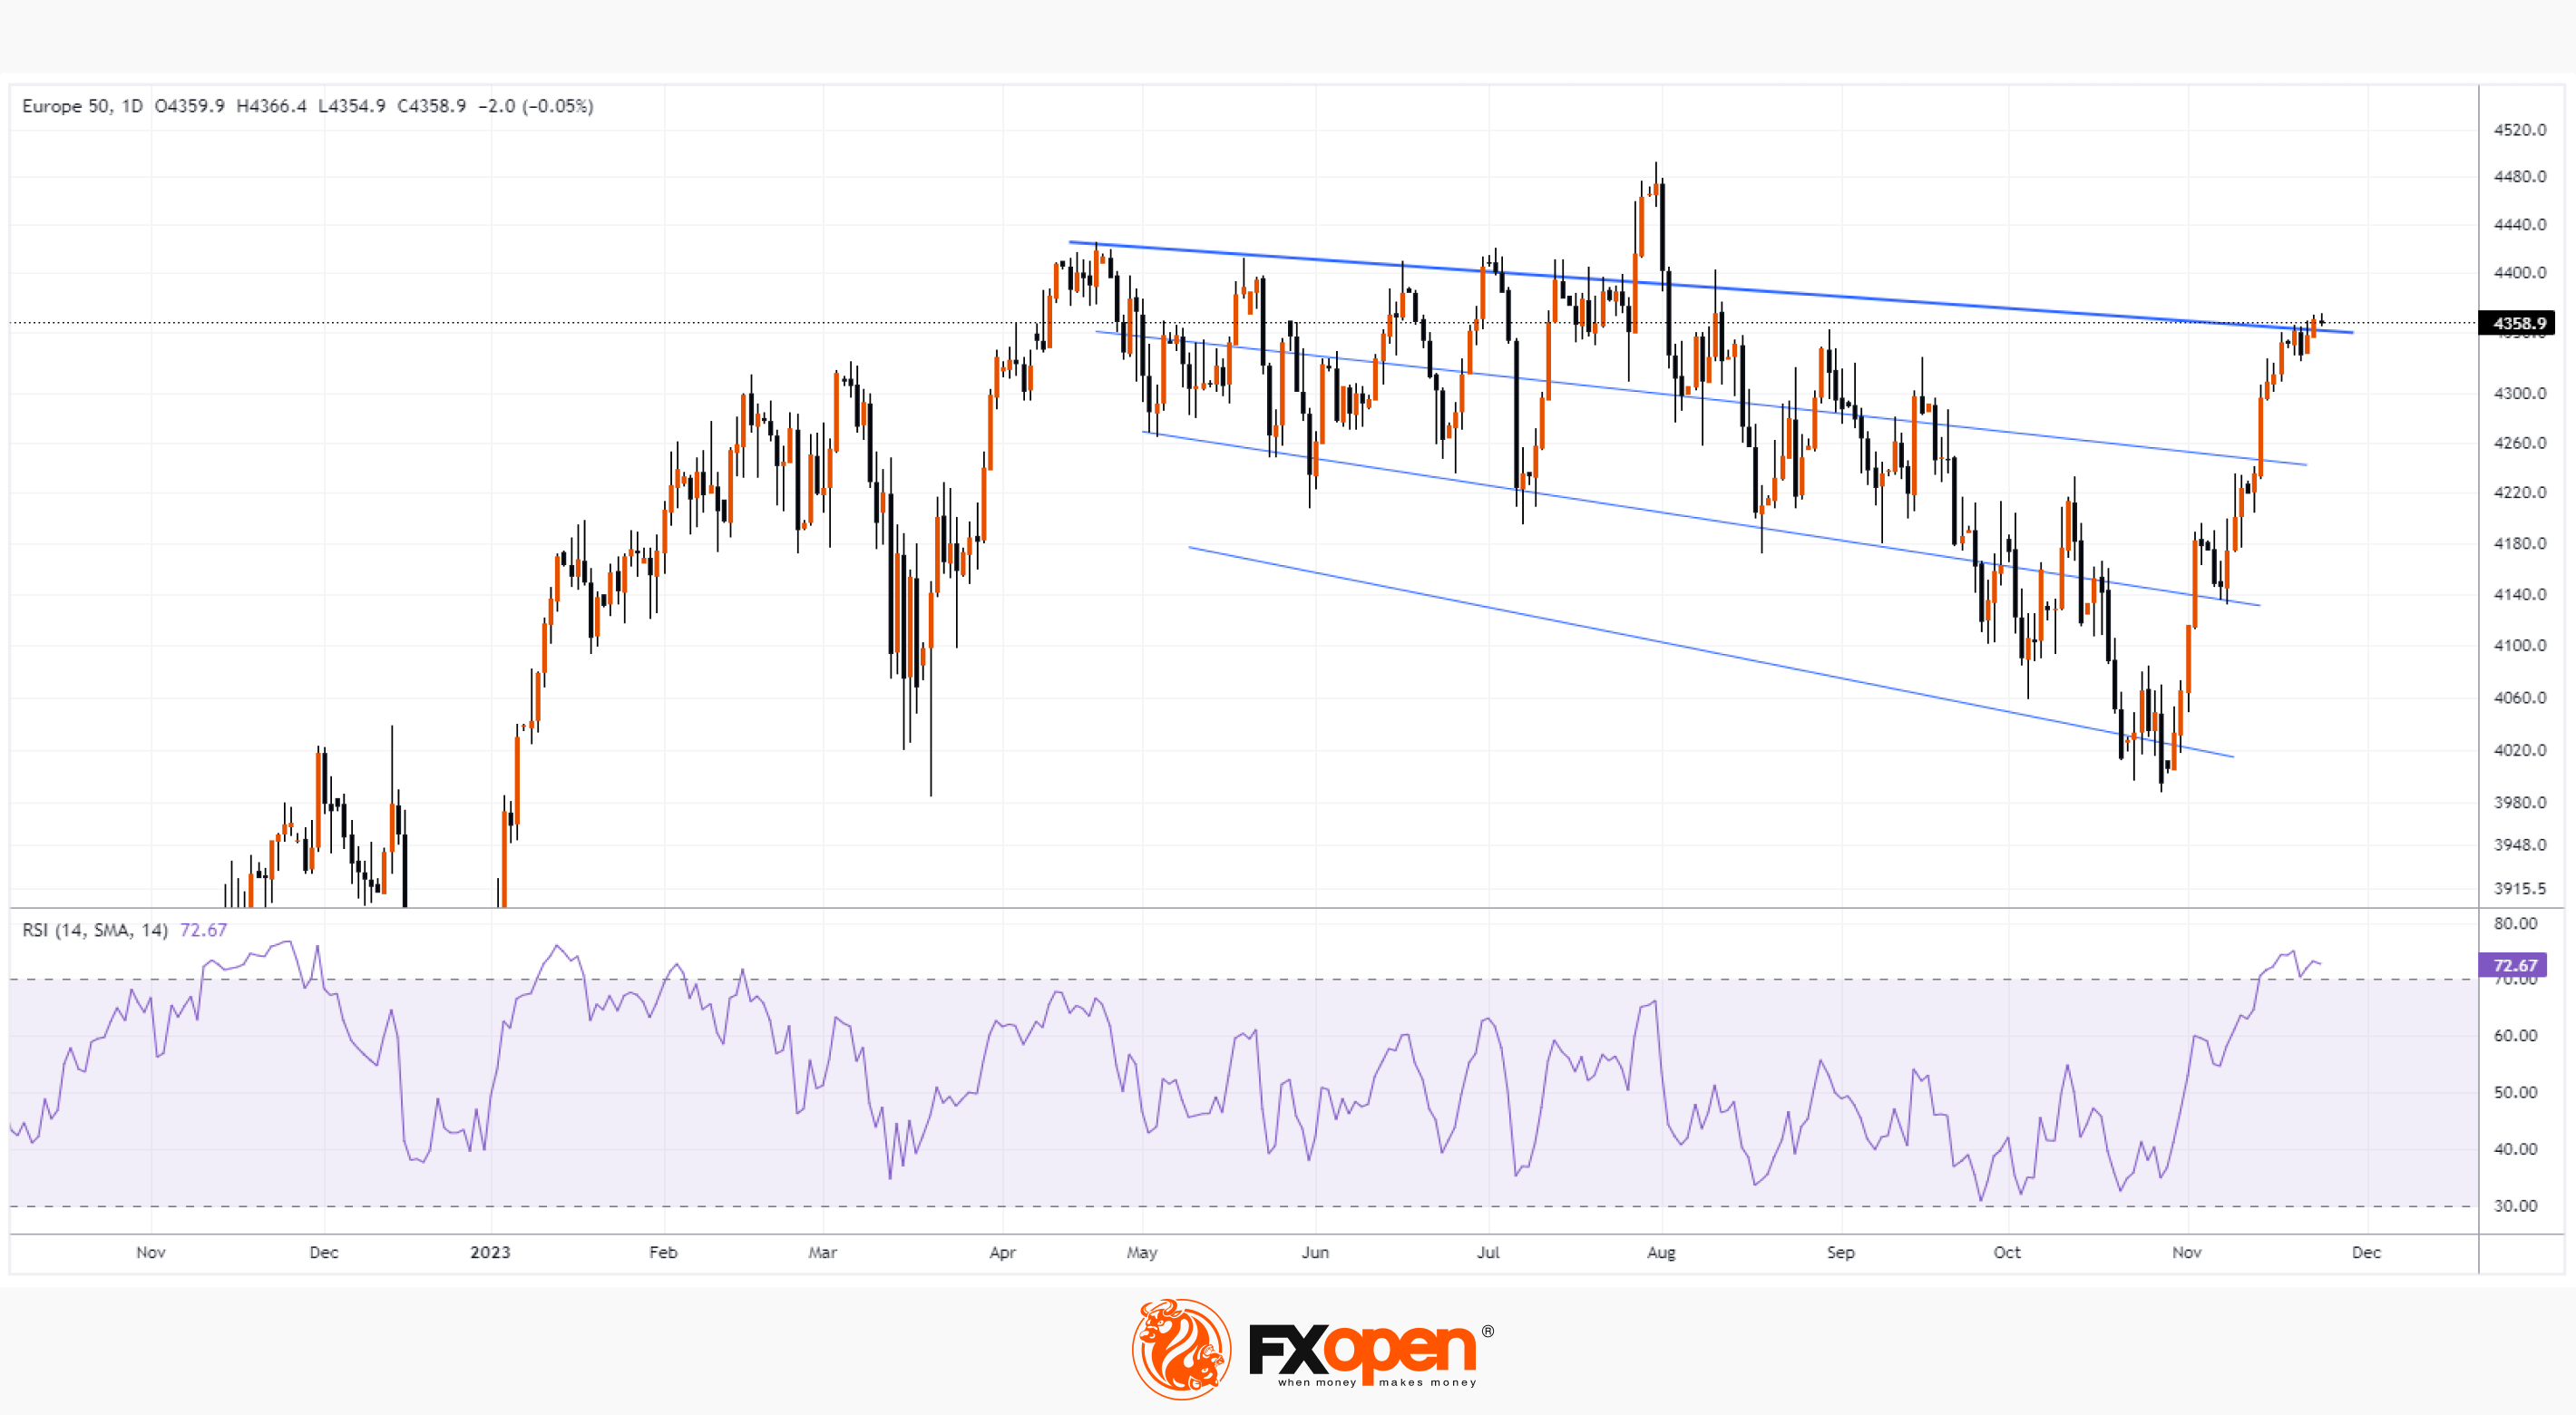
At the same time, the ESX50 index of 50 European shares gained bullish momentum and reached its highest levels since mid-August. Equity market participants may be feeling strongly positive about the rally of more than +9% in less than a month.
However, the daily chart of the ESX50 shows that price dynamics allow a structure of trend lines (shown in blue) to be drawn, reminiscent of a Gann fan. And what's interesting is that the current value has reached an important line (shown as thickening) in this structure, which can serve as resistance - as it did more than once during the period from April to July.
Given that the RSI indicator is forming divergence in the overbought zone, it can be assumed that the market is vulnerable to a pullback.
Trade global index CFDs with zero commission and tight spreads (additional fees may apply). Open your FXOpen account now or learn more about trading index CFDs with FXOpen.
This article represents the opinion of the Companies operating under the FXOpen brand only. It is not to be construed as an offer, solicitation, or recommendation with respect to products and services provided by the Companies operating under the FXOpen brand, nor is it to be considered financial advice.
Stay ahead of the market!
Subscribe now to our mailing list and receive the latest market news and insights delivered directly to your inbox.


Latest articles

AI Valuations Are Back in the Spotlight
Artificial intelligence remains the dominant investment theme of 2026, but investors are increasingly questioning whether AI stock valuations are keeping pace with reality.
💰 Big Tech continues to invest at an unprecedented scale, with hyperscaler AI spending projected to exceed $800

AUD/CAD: Months of Indecision — Is a Breakout Finally Coming?
The Australian dollar has clawed back most of its end-of-June losses, when it touched three-month lows against the greenback amid escalating Middle East tensions. Since then, sentiment has improved: the RBA's Assistant Governor Sarah Hunter signalled the board stands ready

USD/JPY: Battling at the Top of the Triangle
On 3 July, Japan's Finance Minister, Satsuki Katayama, stated that the Ministry of Finance remains in close contact with US authorities regarding developments in USD/JPY as the yen traded near its weakest level in almost 40 years. Similar verbal