


Market Analysis: Eurostoxx 50 at Important Support. Production in Europe is Declining
FXOpen

As data released this morning showed:
→ Purchasing Managers' Index (PMI) in France: actual = 42.6, expected = 44.4, a month ago = 43.6. Thus, the index dropped to its lowest level since the panic associated with the spread of coronavirus.
→ PMI in Germany: actual = 40.7, expected = 40.1, a month ago = 39.8.
Since the values of the PMI index (considered a leading indicator of the state of the economy, calculated by S&P Global) are significantly below 50, this indicates a contraction of the economy in the 2 most important countries of Europe in the context of high interest rates.
It is not surprising that the European stock index Eurostoxx 50 shows bearish dynamics: the price is below the SMA (100), which is directed downwards. The publication of PMI values added negativity. Will the bearish trend continue?
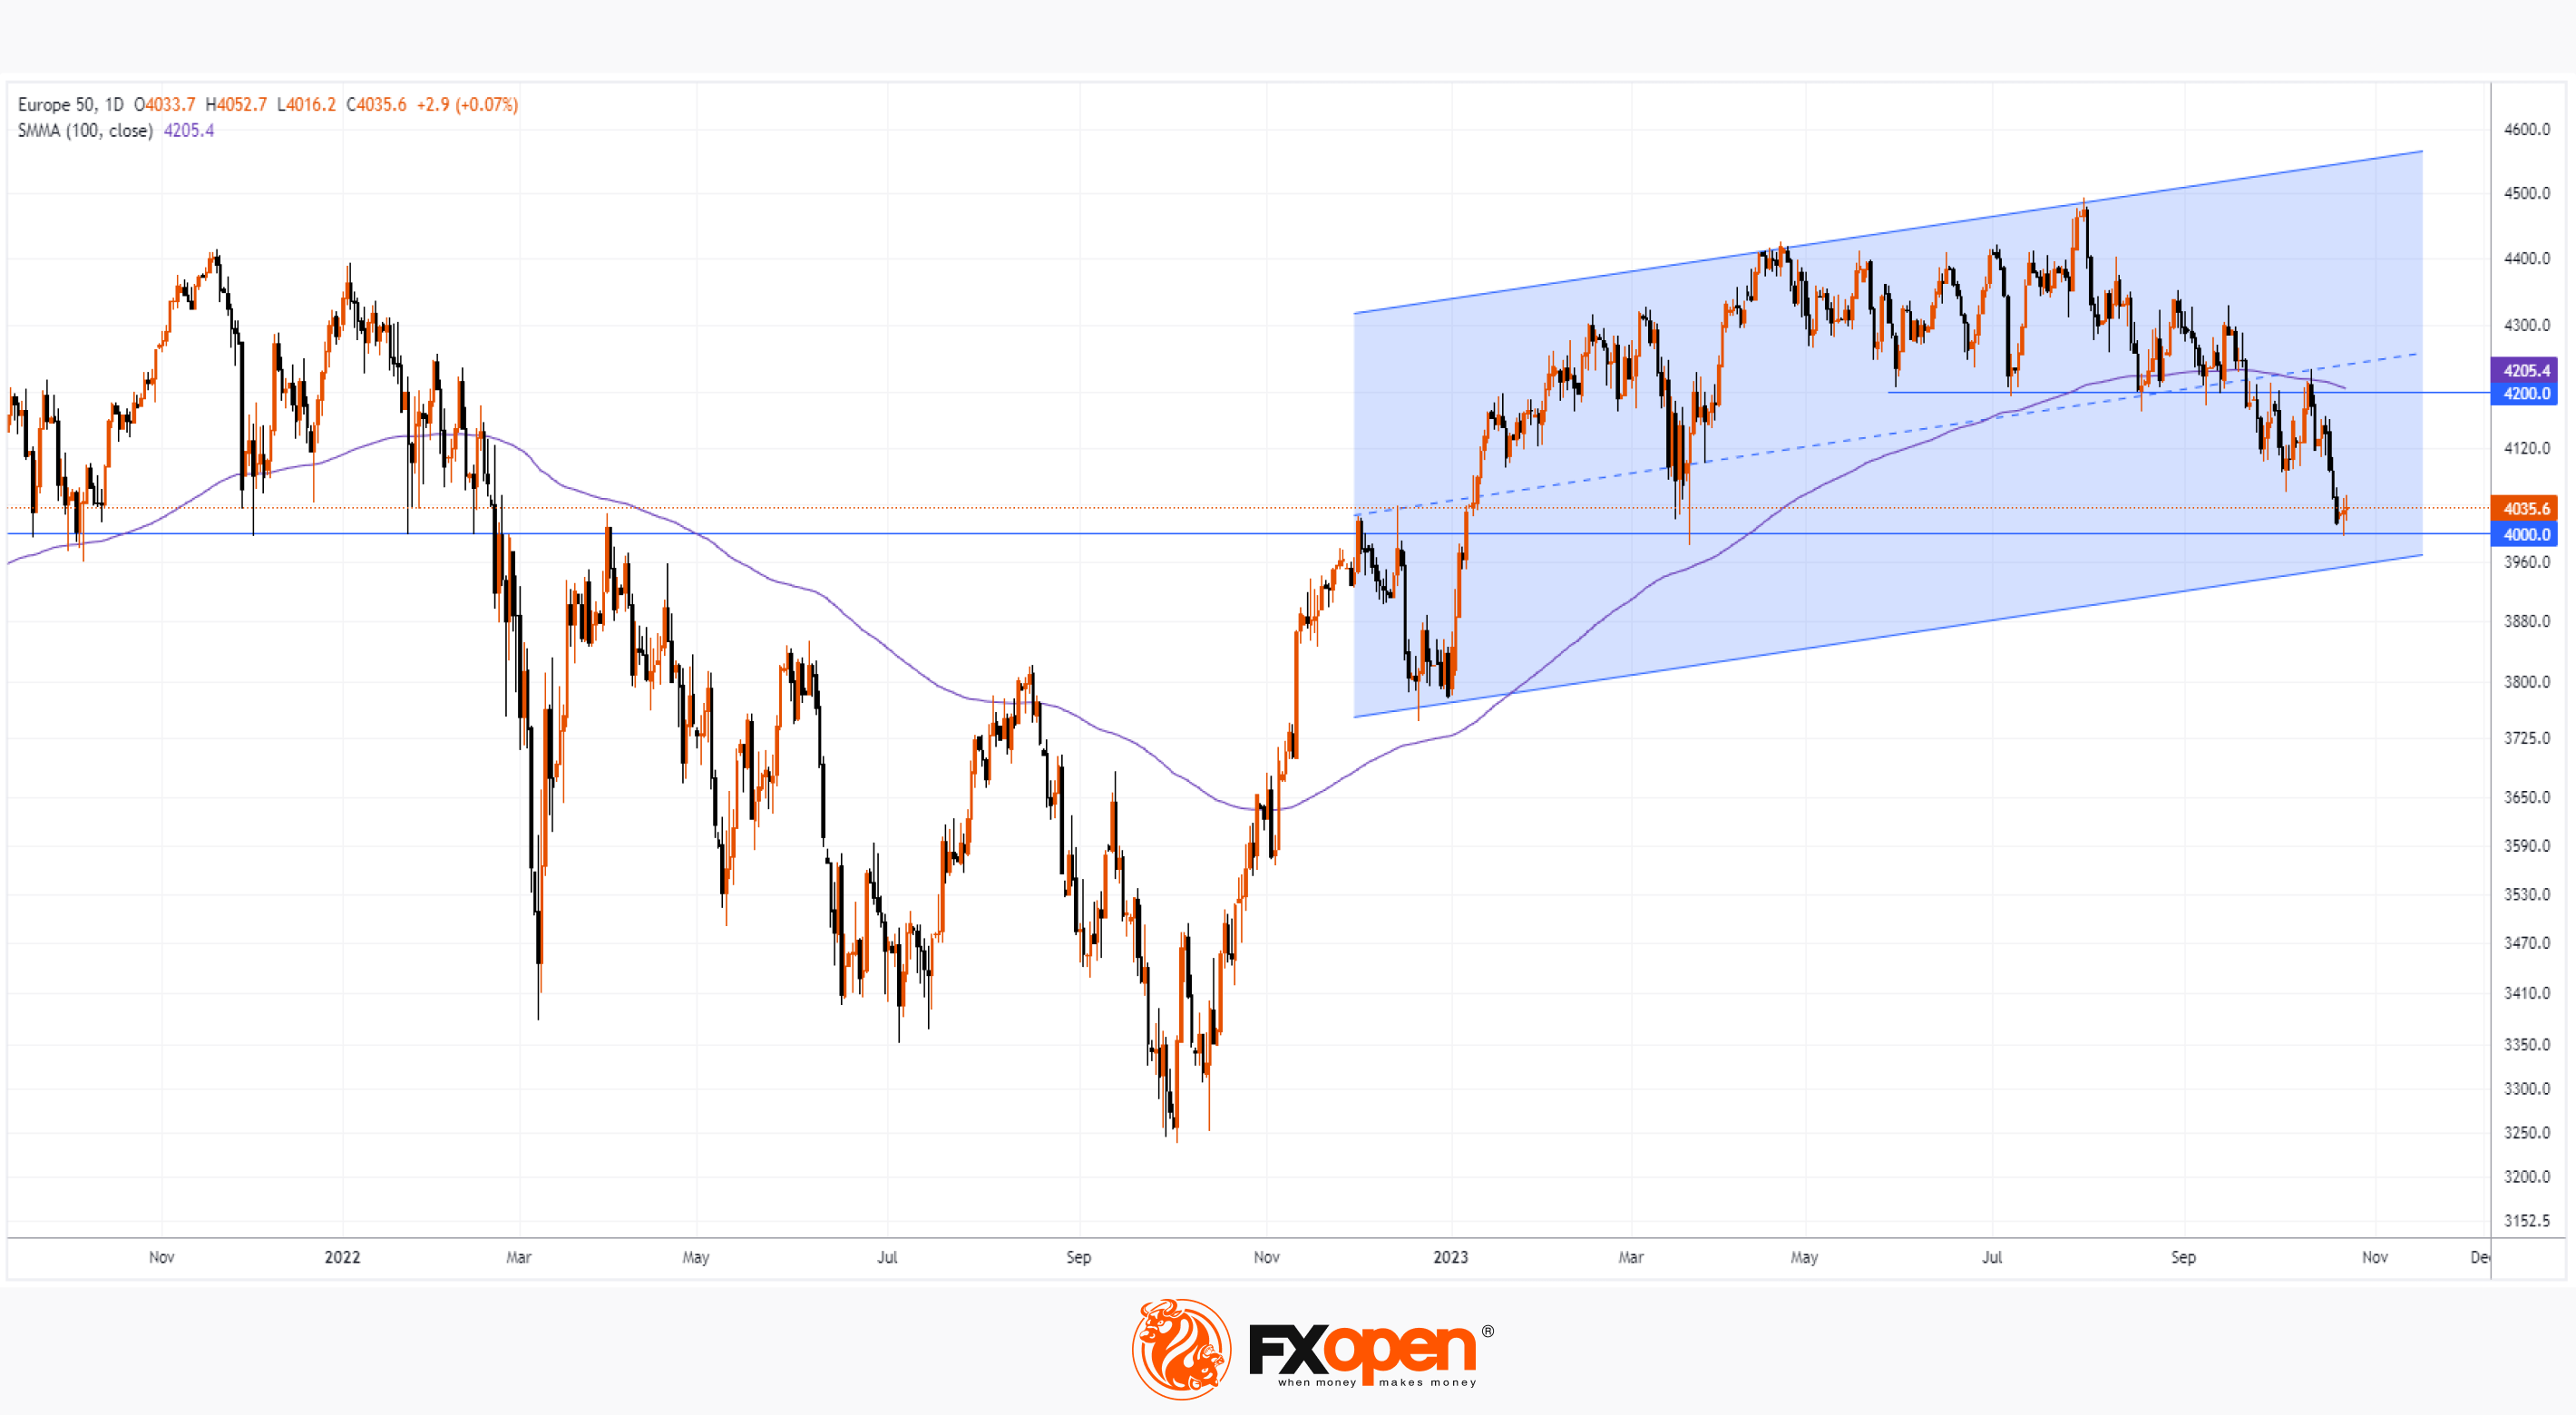
The Eurostoxx 50 chart gives hope, because the Eurostoxx 50 has dropped to key support, which is located at the psychological level of 4,000. In the past, this level has had a noticeable impact on market dynamics: the price either bounced or made a breakout with a subsequent test. This psychological level property can be used to find an entry point into a position while reducing risk.
It is possible that the level of 4,000 may become a factor for the emergence of a bullish impulse, which will lead to a noticeable rebound; the proximity to the lower line of the ascending channel (shown in blue) can also add courage to the bulls.
But for the rebound to develop into a sustainable upward trend, it can be assumed that positive evidence about the state of the European economy will be required.
Trade global index CFDs with zero commission and tight spreads (additional fees may apply). Open your FXOpen account now or learn more about trading index CFDs with FXOpen.
This article represents the opinion of the Companies operating under the FXOpen brand only. It is not to be construed as an offer, solicitation, or recommendation with respect to products and services provided by the Companies operating under the FXOpen brand, nor is it to be considered financial advice.
Stay ahead of the market!
Subscribe now to our mailing list and receive the latest market news and insights delivered directly to your inbox.


Latest articles

AI Valuations Are Back in the Spotlight
Artificial intelligence remains the dominant investment theme of 2026, but investors are increasingly questioning whether AI stock valuations are keeping pace with reality.
💰 Big Tech continues to invest at an unprecedented scale, with hyperscaler AI spending projected to exceed $800

AUD/CAD: Months of Indecision — Is a Breakout Finally Coming?
The Australian dollar has clawed back most of its end-of-June losses, when it touched three-month lows against the greenback amid escalating Middle East tensions. Since then, sentiment has improved: the RBA's Assistant Governor Sarah Hunter signalled the board stands ready

USD/JPY: Battling at the Top of the Triangle
On 3 July, Japan's Finance Minister, Satsuki Katayama, stated that the Ministry of Finance remains in close contact with US authorities regarding developments in USD/JPY as the yen traded near its weakest level in almost 40 years. Similar verbal