


Market Analysis: FTSE Drops Rapidly to April Lows Today
FXOpen

The FTSE 100 index is rapidly declining on Wednesday morning amid news of another spike in inflation. The Core CPI (excluding energy, food and tobacco prices) reached 6.8%, the highest in over 30 years. Market participants are now almost certain that the Bank of England will raise interest rates at its next meeting.
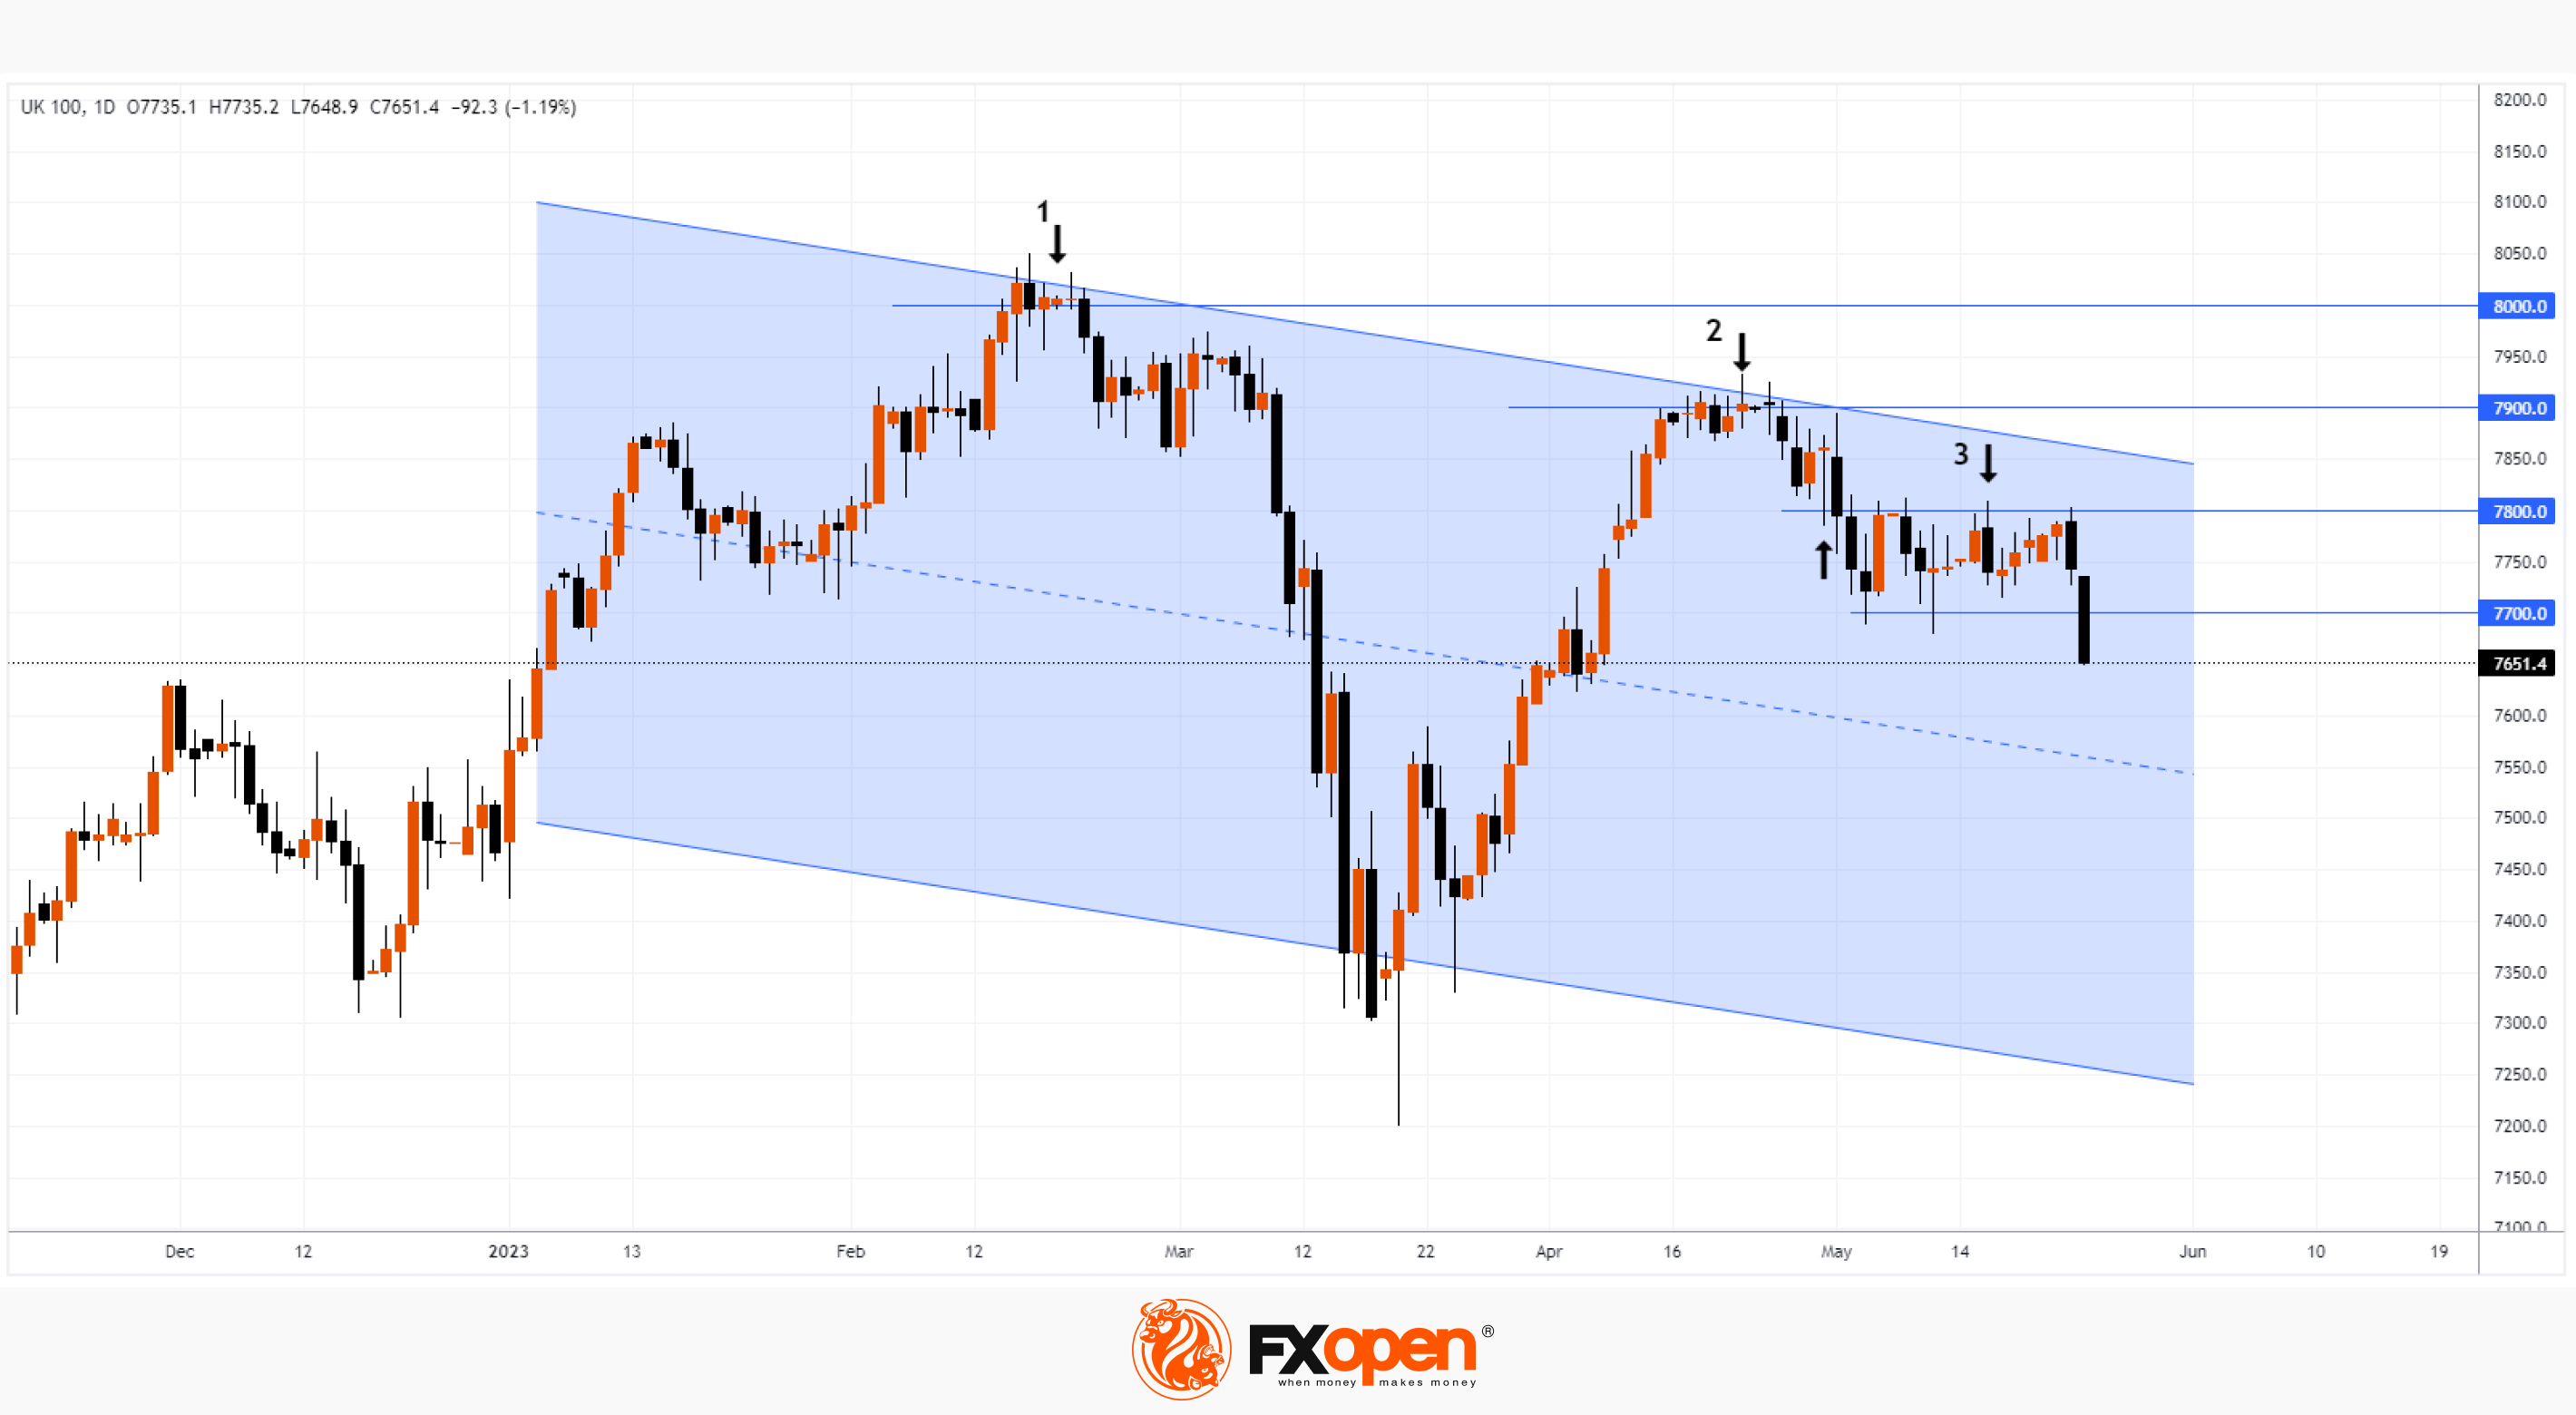
The UK100 chart (a tool that reflects the dynamics of the FTSE 100 index) shows a consistent series of bull failures around psychologically significant levels:
1→ UK100 price failed to settle above 8,000 in February;
2→ UK100 price did not fix above 7,900 in April;
3 → level 7,800 used to be support but is now resisting.
The action of the UK100 price today suggests that the level of 7,700 may now also provide resistance in an attempt to increase. If the downtrend strengthens, the FTSE may continue to decline within the channel (shown in blue), reaching its median line (or even the lower border — which would mean a 2023 low).
Trade global index CFDs with zero commission and tight spreads (additional fees may apply). Open your FXOpen account now or learn more about trading index CFDs with FXOpen.
This article represents the opinion of the Companies operating under the FXOpen brand only. It is not to be construed as an offer, solicitation, or recommendation with respect to products and services provided by the Companies operating under the FXOpen brand, nor is it to be considered financial advice.
Stay ahead of the market!
Subscribe now to our mailing list and receive the latest market news and insights delivered directly to your inbox.


Latest articles

Weekly Market Insights with Gary Thomson: The Week of Central Banks and Earnings
In this video, we’ll explore the key economic events and market trends, shaping the financial landscape. Get ready for insights into financial markets to help you navigate the week ahead. Let’s dive in!
In this episode of Market

Intel at a Crossroads: Earnings Beat Meets Technical Resistance
Intel has just delivered its strongest quarter in over fifteen years, and the market reaction says it all. Q2 2026 revenue surged 25% year-over-year to $16.1 billion, crushing the consensus estimate of $14.42 billion, while adjusted EPS of

Tesla: Complex Range Structure Breaks Down Following Quarterly Earnings
Tesla released its Q2 2026 results after the market closed on 22 July. Revenue increased 26% year-on-year to $28.24 billion, while vehicle deliveries reached a record 480,126 units. However, operating margin fell sharply to 1.4%, down from