


Market Analysis: Morgan Stanley Analysts Raise Forecasts for S&P 500
FXOpen
According to them:
→ the price of the S&P 500 index will reach 4,500 at the end of the year (previous forecast = 4,200);
→ the dollar will continue to remain strong.
According to Goldman Sachs analysts, published yesterday, the price of the S&P 500 index will fluctuate around current levels, forming a consolidation zone.
That is, a decline in the S&P 500 is not a priority scenario. An important test that will provide more important information about current market sentiment will occur today: US inflation data will be published at 16:30 GMT+3. According to forecasts, it will slow down from 3.7% to 3.3%.
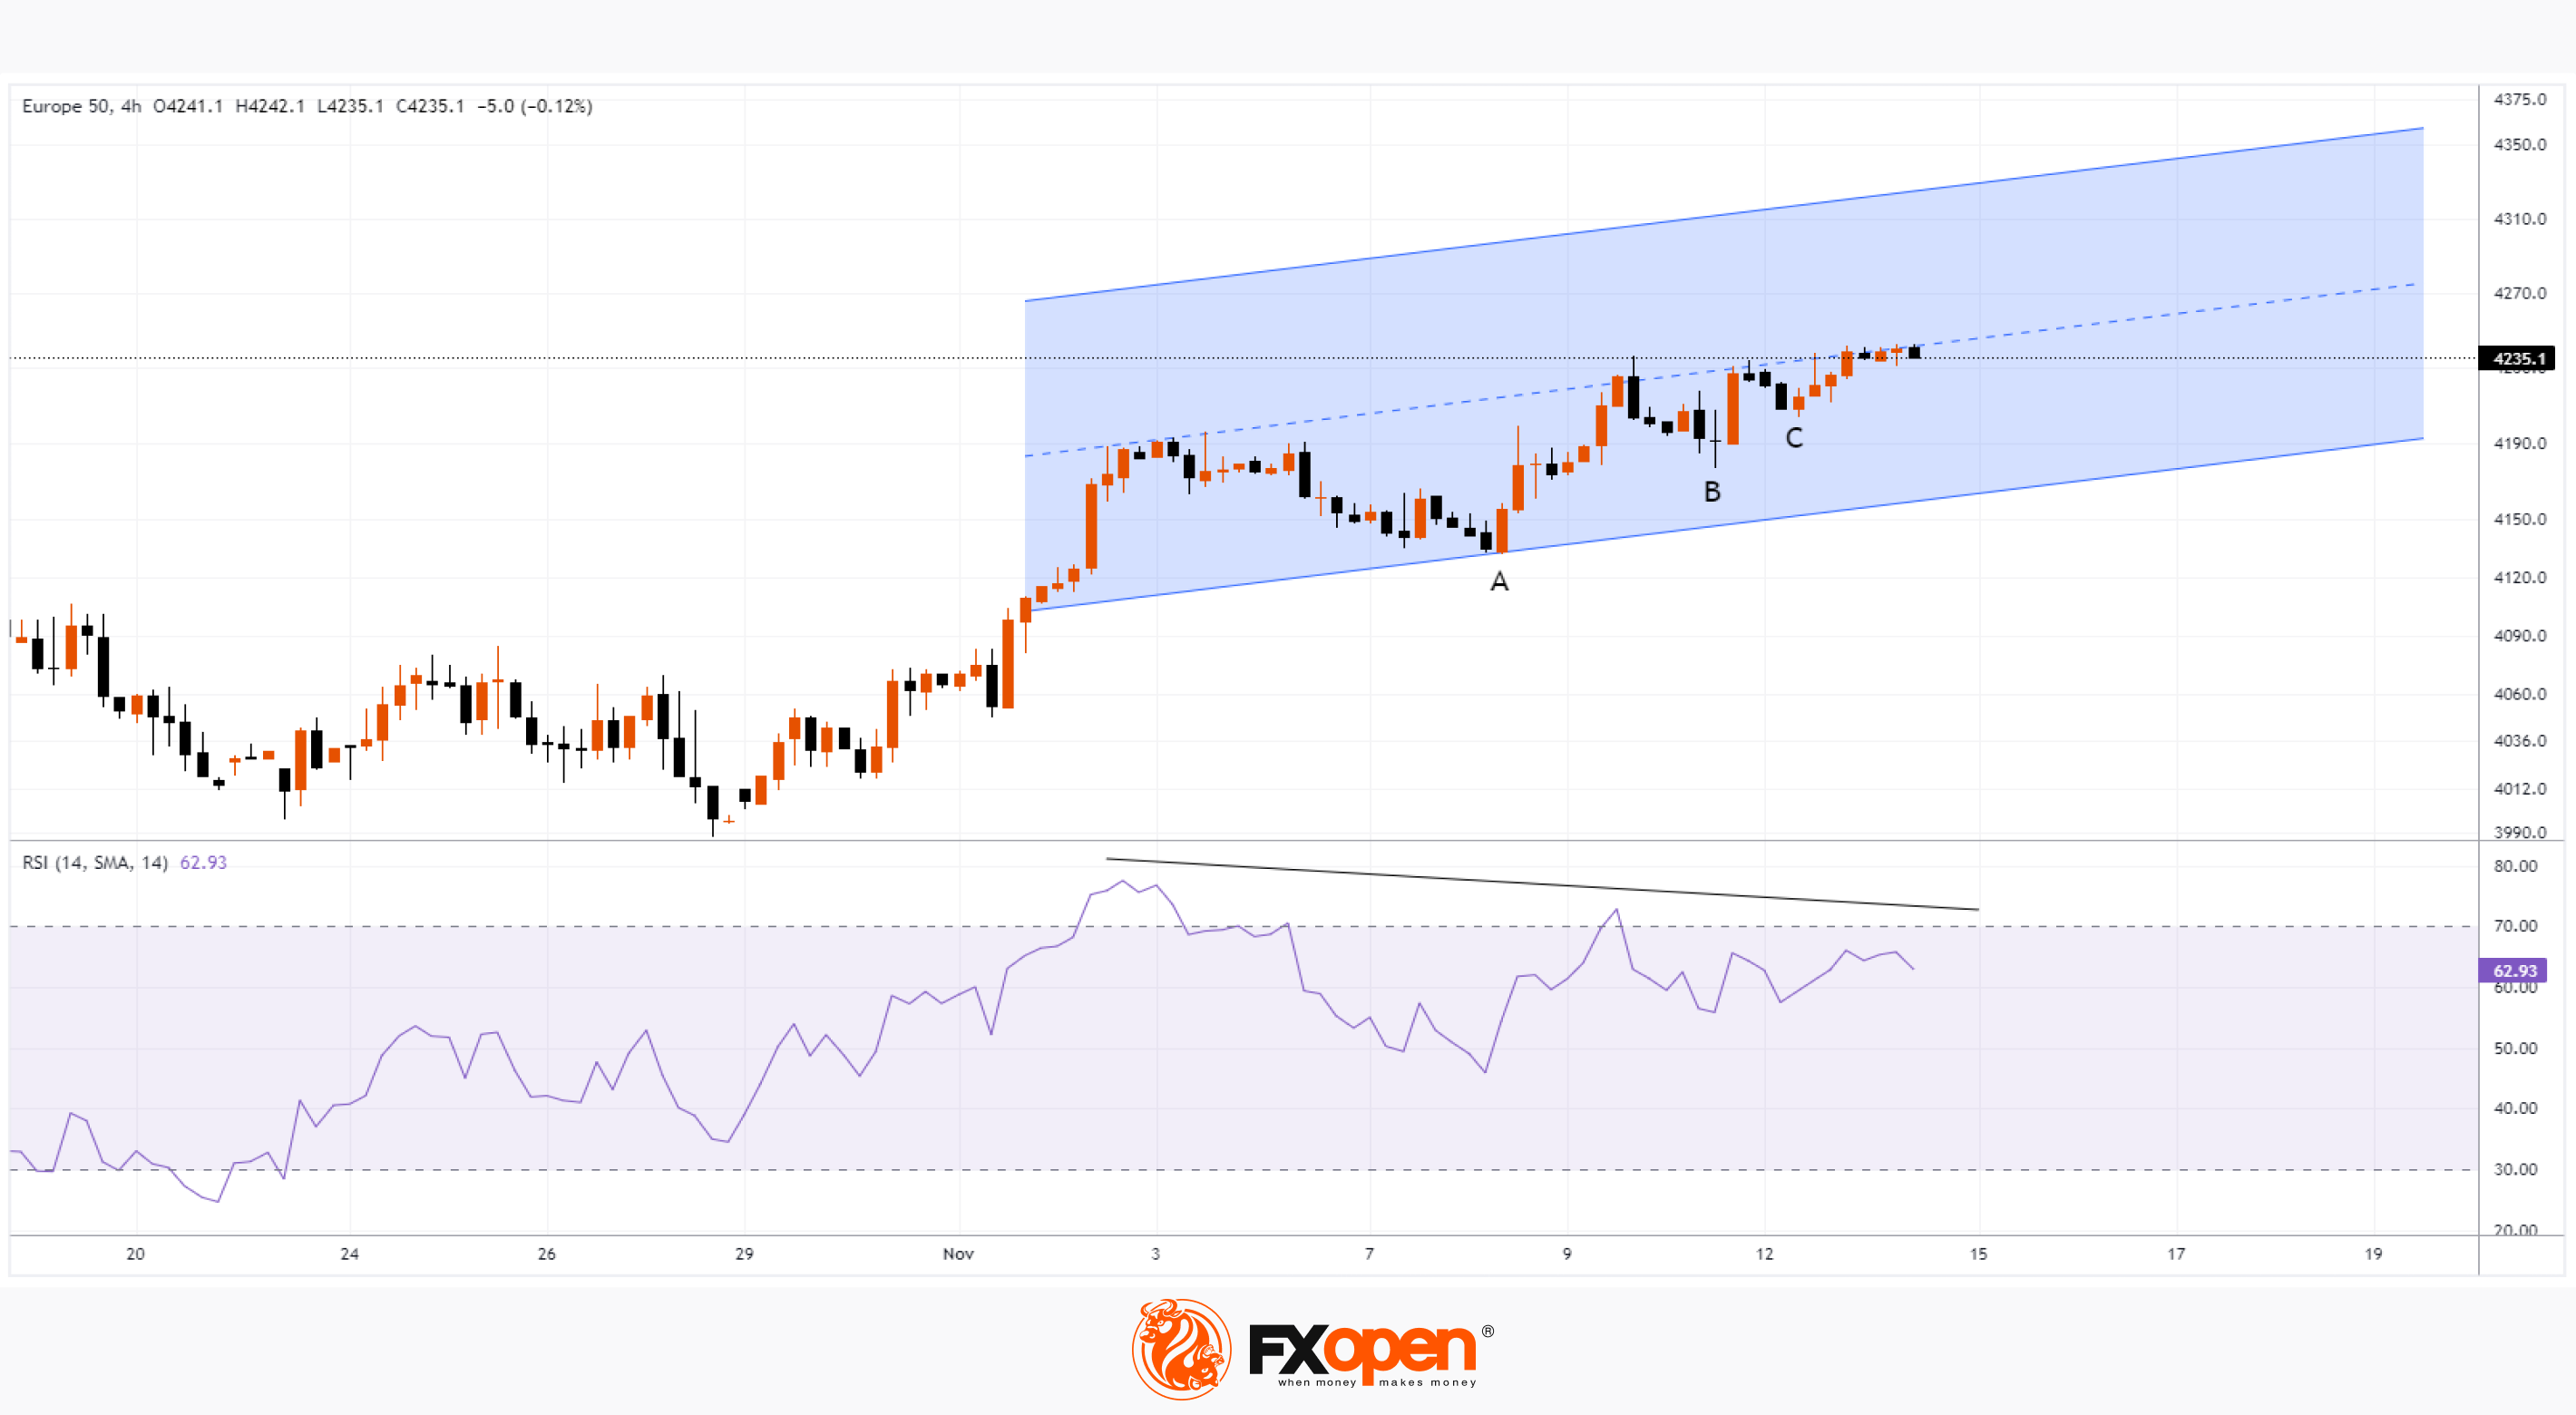
In anticipation of news, E-mini S&P 500 index futures are showing reduced volatility. If inflation data gives rise to bullish momentum, it is possible that the price of the S&P 500 will move up, pushing off from the median line of the ascending channel (shown in blue). Then, justifying the forecasts of MS analysts, the price may reach the upper limit of the channel this month.
Also worth paying attention to:
→ increasing local minima A, B, C show signs of demand strength;
→ RSI indicates non-divergence, increasing the likelihood of a movement to the lower border of the channel.
Trade global index CFDs with zero commission and tight spreads (additional fees may apply). Open your FXOpen account now or learn more about trading index CFDs with FXOpen.
This article represents the opinion of the Companies operating under the FXOpen brand only. It is not to be construed as an offer, solicitation, or recommendation with respect to products and services provided by the Companies operating under the FXOpen brand, nor is it to be considered financial advice.
Stay ahead of the market!
Subscribe now to our mailing list and receive the latest market news and insights delivered directly to your inbox.


Latest articles

EUR/USD Analysis: Who Is in Control?
Two central banks, two hawkish tones — but only one dollar just took a hit. The ECB delivered a 25bp hike in June, its first since 2023, lifting the deposit rate to 2.25% as Middle East-driven energy costs pushed headline

Gold Resumes Its Advance Following the US Labour Market Report
Gold is attempting to break its medium-term trend, with the latest US labour market data acting as the main catalyst. The US employment report released on 2 July came in noticeably weaker than expected, with the pace of hiring slowing

NZD/CHF Analysis: Which Currency Breaks the Consolidation First?
NZD/CHF remains locked in a tight range as traders await the next monetary policy catalyst.
The Reserve Bank of New Zealand heads into Wednesday's meeting on shaky ground. After May's 3-3 split was resolved by a casting vote, the