


Market Analysis: Nasdaq 100 Tests Important Support
FXOpen

FactSet agency notes a disturbing feature of the current reporting season in the US stock market: if a company publishes a report that exceeds forecasts, its share price does not react with a price increase, which should be expected. This hasn't happened since August 2011, when the stock market fell over 15% in 2 weeks.
This behavior may suggest that the stock market is overbought (due to the AI boom), and a reason to more closely monitor the nature of the test of the 15,280 support level by the price of the Nasdaq 100. The Nasdaq 100 daily chart gives hints that the bears are seizing the initiative:
→ the price of the index has formed a head-and-shoulders pattern;
→ the price goes down to the lower half of the rising channel;
→ since July 19, the chart shows 2 lower tops and 2 lower lows.
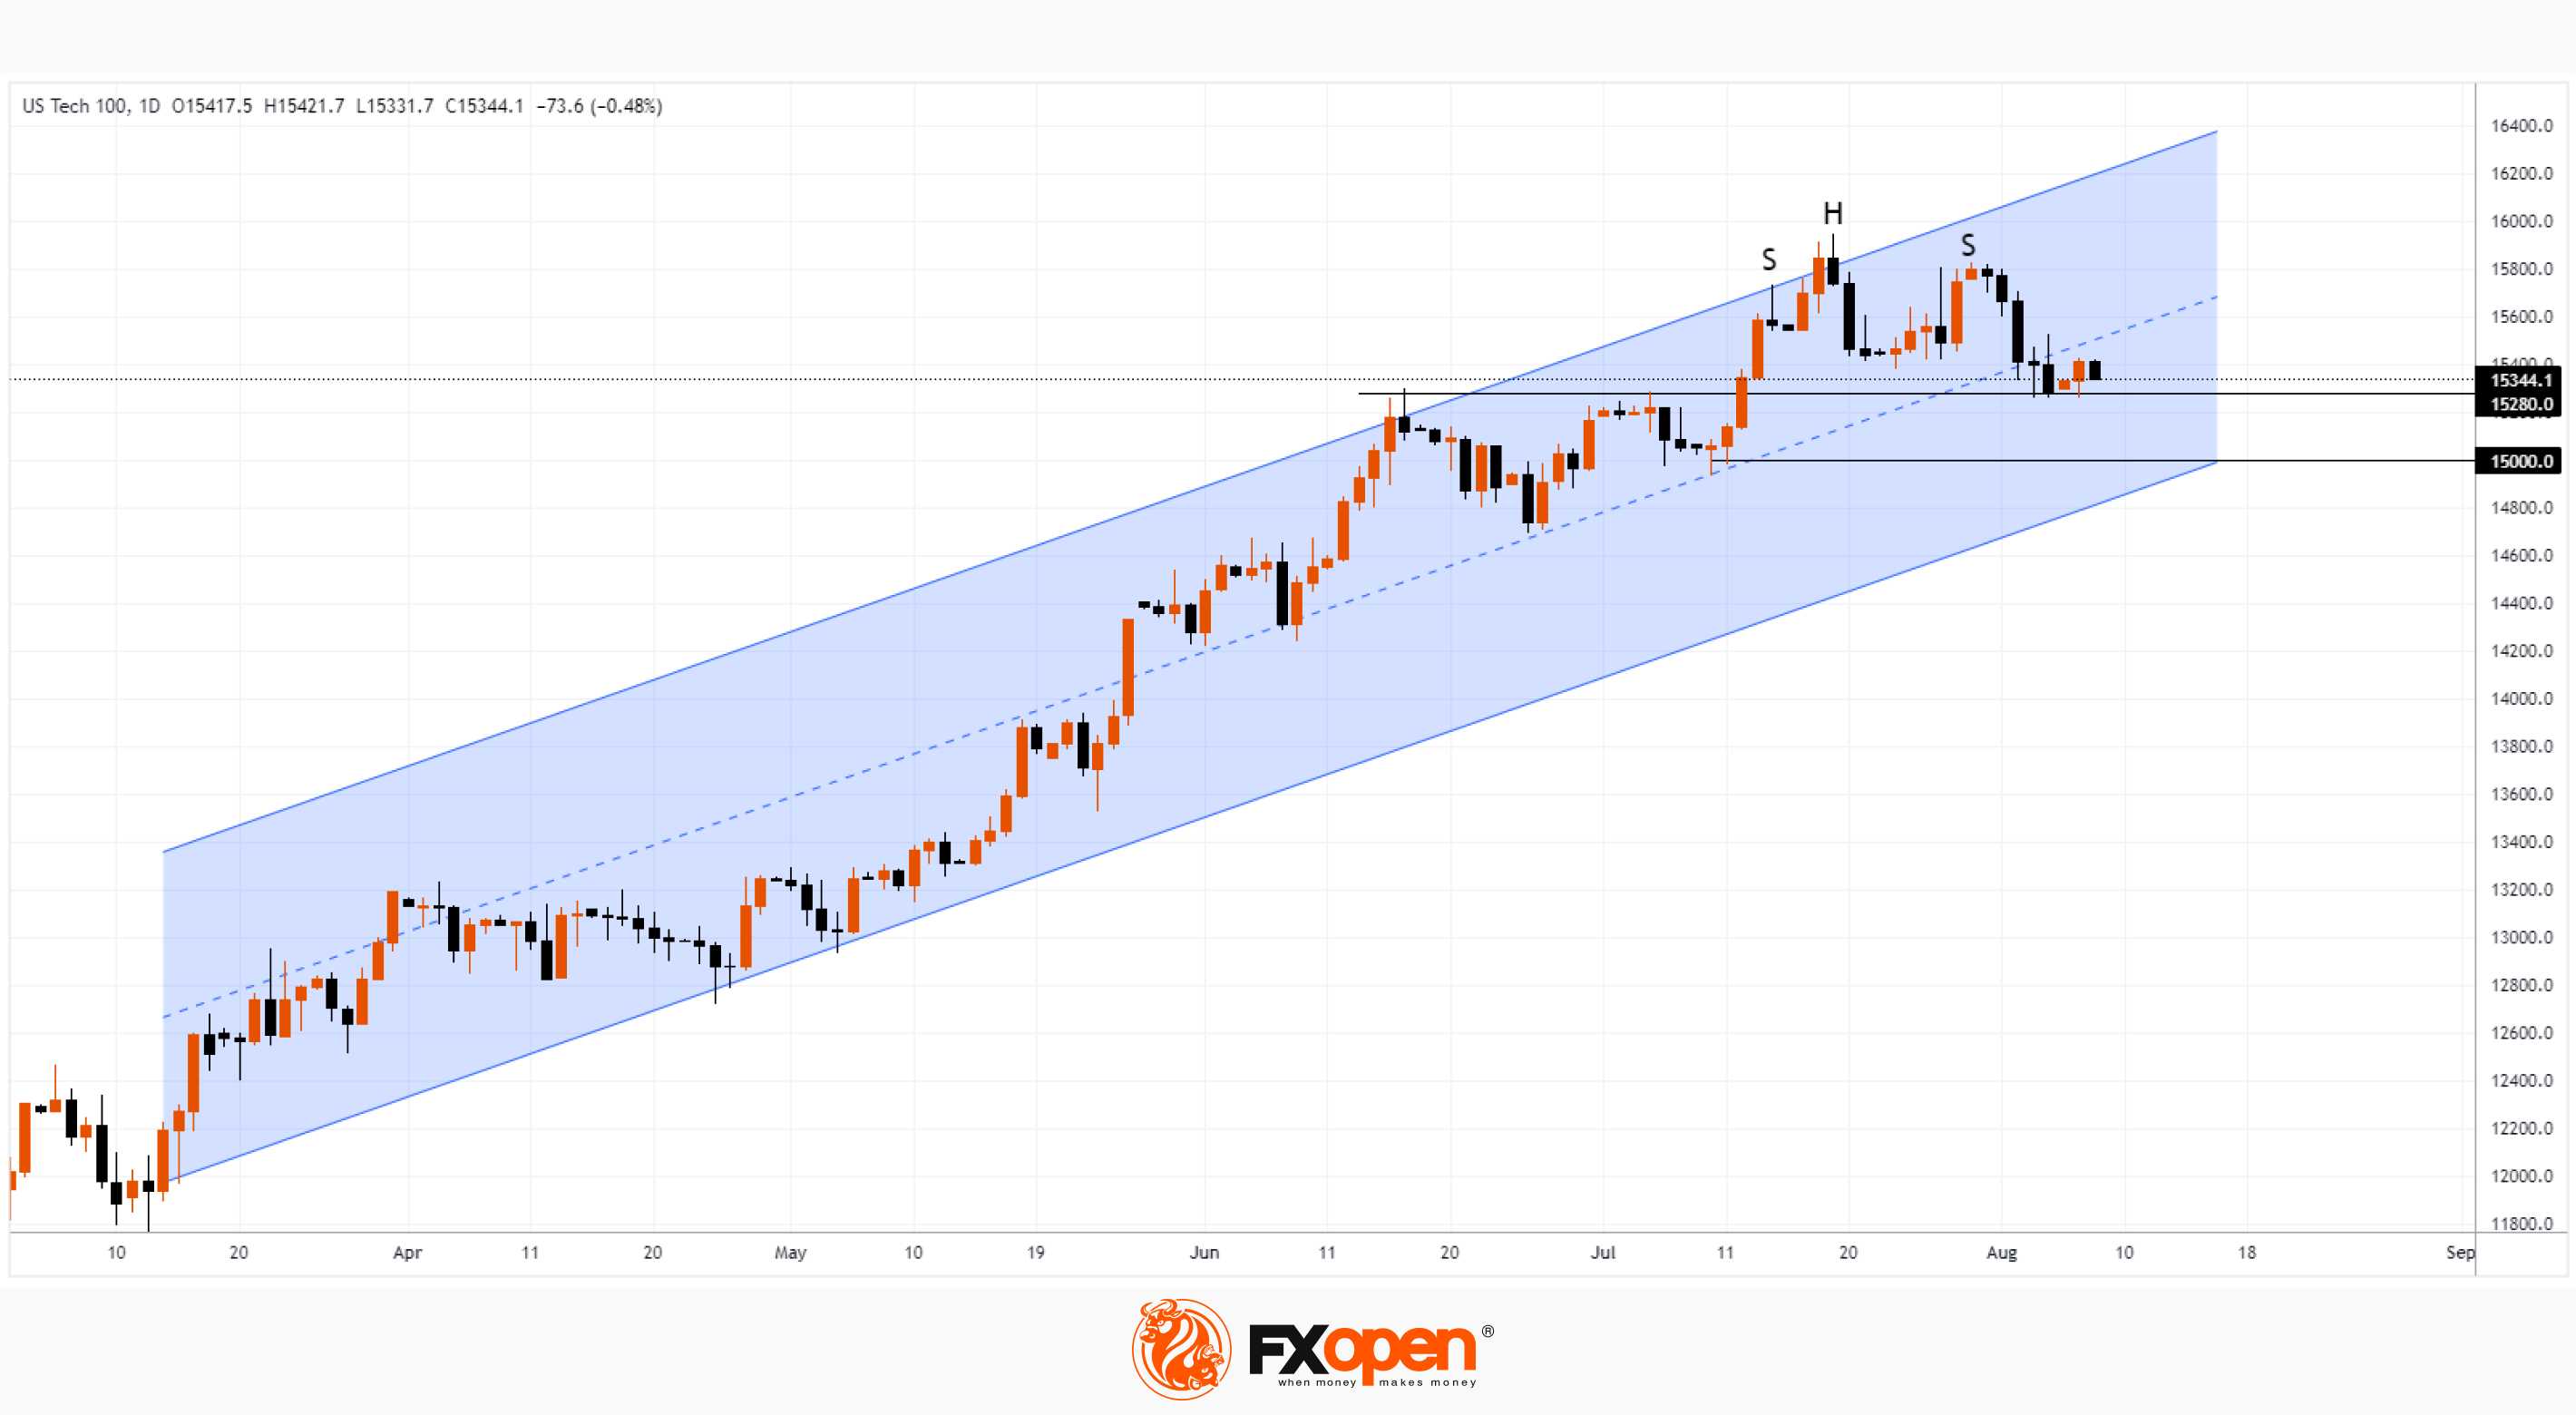
If the bears break through the level of 15,280, the next target could be the psychological level of 15,000, in the area of which the lower border of the ascending channel that operates this summer passes — this block can provide significant support.
Trade global index CFDs with zero commission and tight spreads (additional fees may apply). Open your FXOpen account now or learn more about trading index CFDs with FXOpen.
This article represents the opinion of the Companies operating under the FXOpen brand only. It is not to be construed as an offer, solicitation, or recommendation with respect to products and services provided by the Companies operating under the FXOpen brand, nor is it to be considered financial advice.
Stay ahead of the market!
Subscribe now to our mailing list and receive the latest market news and insights delivered directly to your inbox.


Latest articles

DAX 40: consolidation amid technology sell-off
A wave of selling in the technology sector that emerged earlier this week has weighed on European equities. The trigger was investor concern over the profitability of large-scale debt-funded investments by major US tech companies in AI infrastructure. The Nasdaq

Euro Hits Fresh Yearly Lows Amid Dovish ECB Signals
The euro remains under pressure following weak macroeconomic data from the euro area and fresh signals that the European Central Bank is prepared to maintain a more accommodative monetary policy stance. Data released yesterday pointed to a deterioration in business

Pound at Key Levels: Markets Assess Impact of Political Uncertainty in the UK
The British pound remains under pressure following increased political uncertainty in the United Kingdom triggered by the Prime Minister’s resignation. Investors are assessing potential shifts in the political and economic policy outlook after the head of government stepped down,