


Market Analysis: Nikkei 225 Reaches Psychological Level at 33,000
FXOpen
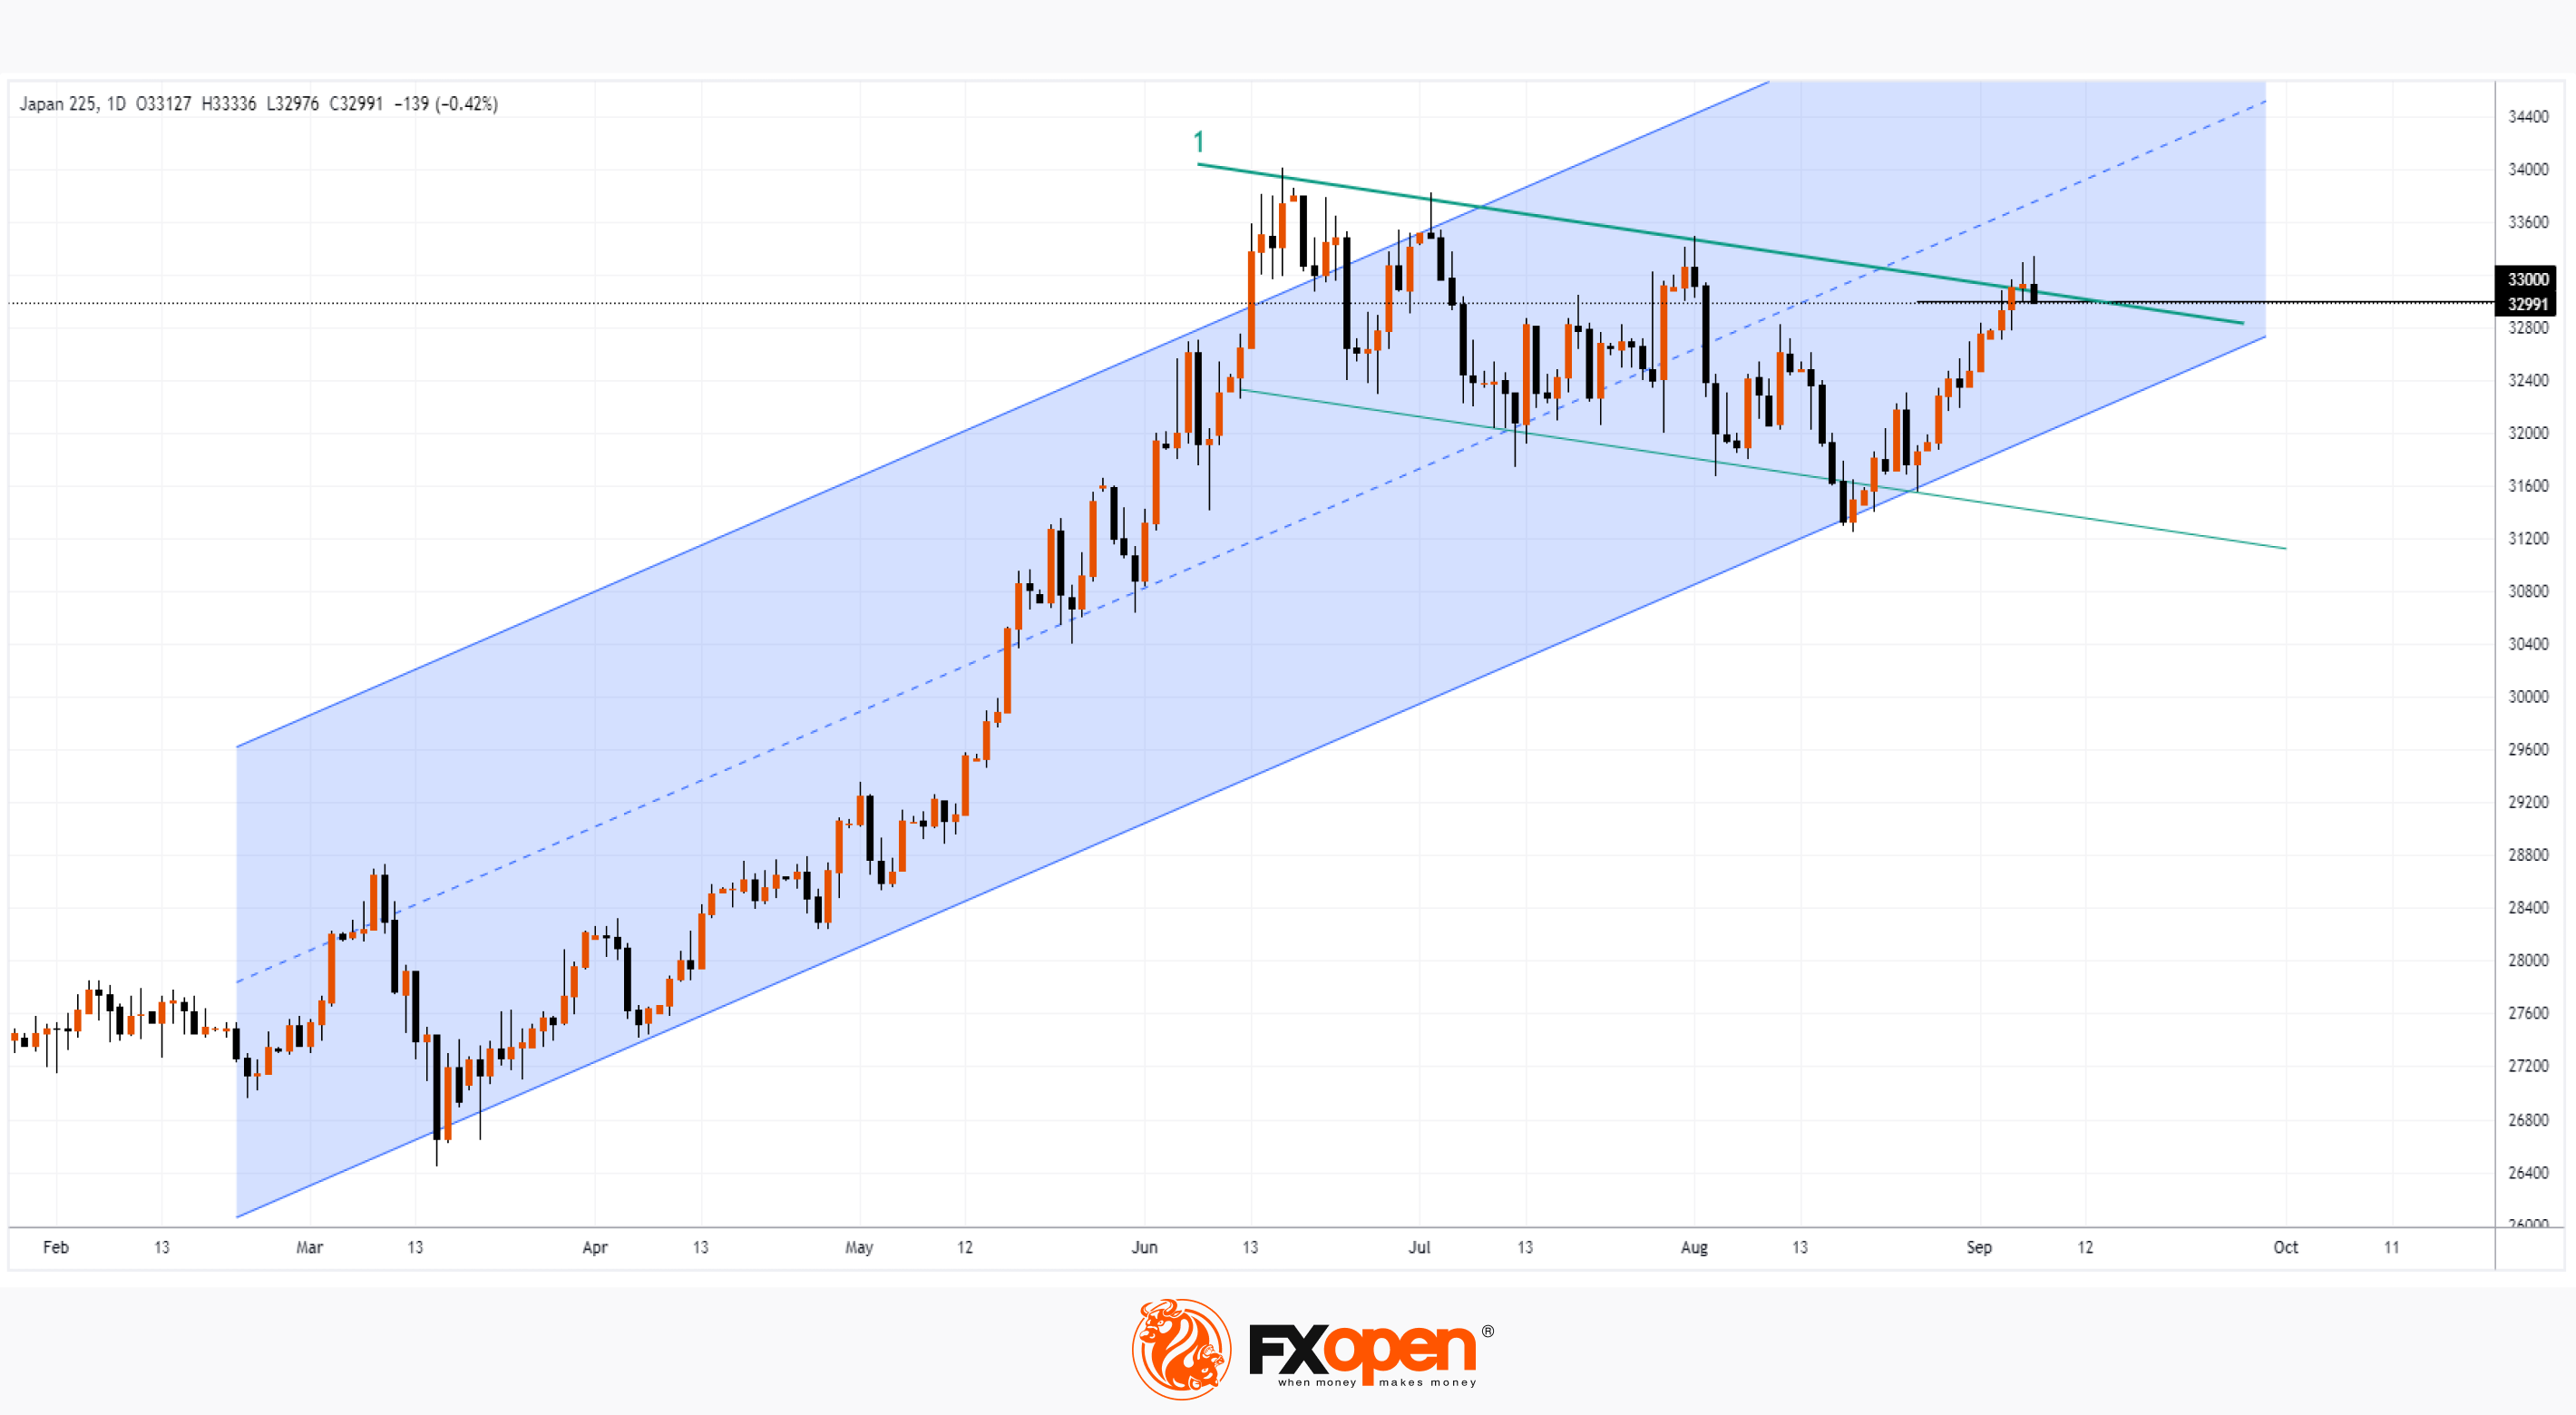
In 2023, Japan's stock market is in a bullish trend (shown by the blue channel) as the country has an ultra-loose monetary policy (unlike other G7 countries that are fighting inflation). As a result, the cheap yen helps Japanese companies, which are largely export-oriented, to develop. According to the Cabinet of Japan, GDP in the second quarter of 2023 increased by 2% compared to the same quarter of the previous year.
The growth of the Japanese stock market from the beginning of the year to today is about 28%. And on Sept. 5, the Nikkei 225 closed above the psychological 33,000 level. Yahoo Finance reports that Kenji Abe, Daiwa Securities equity strategist, predicts the Nikkei could gradually rise to 35,000 after a strong reporting season this summer.
Bearish arguments:
→ the level of 33,000 points can serve as psychological resistance. After the Doji candle on September 6 (which can be interpreted as the uncertainty of market participants in the continuation of growth), the price dropped on the morning of September 7, which confirms the weakening of demand.
→ line (1), built on the highs of summer, can provide resistance.
However, the bullish argument is that the line (1) is an element of the flag technical analysis pattern. If the pattern works, then we should expect its breakdown and the continuation of the trend in 2023. How likely this scenario is can be judged by the depth of the rollback from the line (1), which is already looming on the chart.
Trade global index CFDs with zero commission and tight spreads (additional fees may apply). Open your FXOpen account now or learn more about trading index CFDs with FXOpen.
This article represents the opinion of the Companies operating under the FXOpen brand only. It is not to be construed as an offer, solicitation, or recommendation with respect to products and services provided by the Companies operating under the FXOpen brand, nor is it to be considered financial advice.
Stay ahead of the market!
Subscribe now to our mailing list and receive the latest market news and insights delivered directly to your inbox.


Latest articles

AI Valuations Are Back in the Spotlight
Artificial intelligence remains the dominant investment theme of 2026, but investors are increasingly questioning whether AI stock valuations are keeping pace with reality.
💰 Big Tech continues to invest at an unprecedented scale, with hyperscaler AI spending projected to exceed $800

AUD/CAD: Months of Indecision — Is a Breakout Finally Coming?
The Australian dollar has clawed back most of its end-of-June losses, when it touched three-month lows against the greenback amid escalating Middle East tensions. Since then, sentiment has improved: the RBA's Assistant Governor Sarah Hunter signalled the board stands ready

USD/JPY: Battling at the Top of the Triangle
On 3 July, Japan's Finance Minister, Satsuki Katayama, stated that the Ministry of Finance remains in close contact with US authorities regarding developments in USD/JPY as the yen traded near its weakest level in almost 40 years. Similar verbal