


Market Analysis: NVDA Shares Decline after Strong Report
FXOpen

The previous historical record and maximum for 2023 (USD 502.66 per share) was set on August 24 against the backdrop of the publication of the 2nd quarter report.
This week, NVidia published its report for the Q3, and again the price set a record high, as the report turned out to be better than expected:
→ earnings per share: actual = USD 4.02, forecast = USD 3.37;
→ gross revenue: actual = USD 18.12 billion, forecast = USD 16.18 billion.
However, after the publication of the report, the NVDA share price shows bearish dynamics — perhaps the information from the company disappointed overly optimistic investors. Or perhaps some market participants used the excitement associated with the publication of the report in order to lock in profits from the 2023 rally.
However, NVDA shares fell 2.6% yesterday after CFO Colette Kress said sales to China, impacted by recent US government export controls, would decline significantly in the fourth quarter.
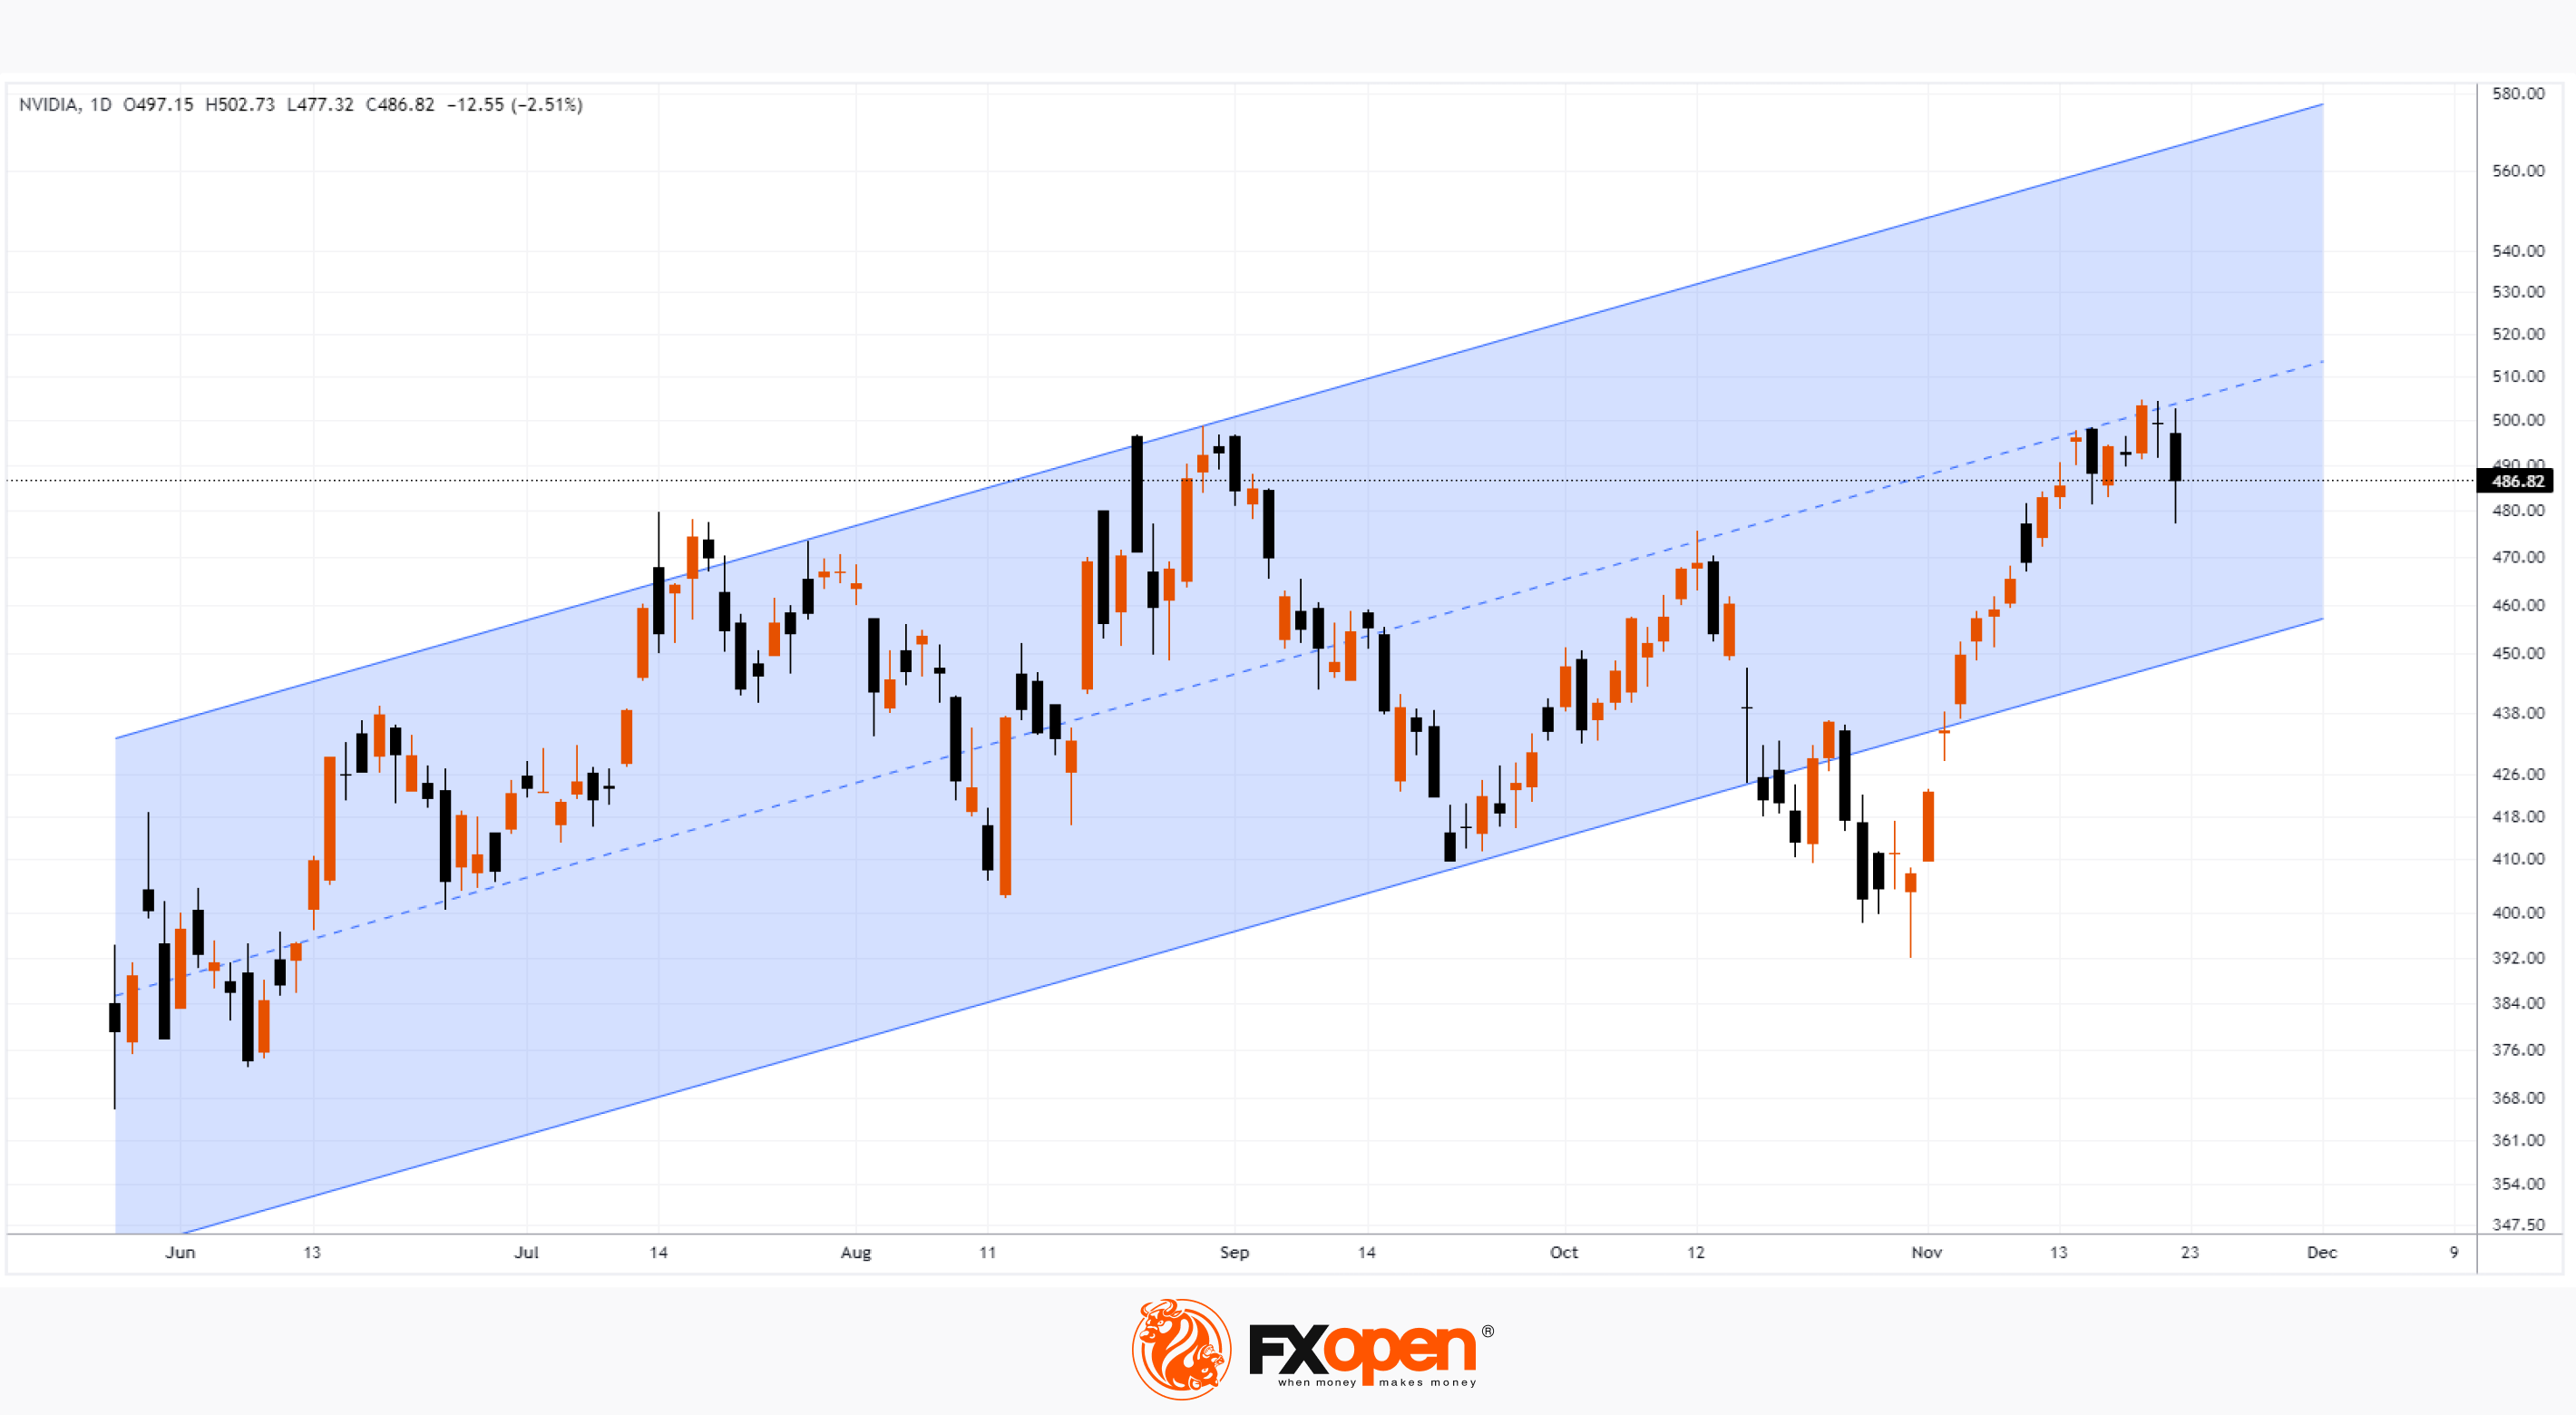
Thus, the chart of NVDA shares develops a picture that may worry the bulls:
→ The price fell below USD 480 per share yesterday, despite the recently published good report.
→ The price is near the median line of the ascending channel, which describes the market dynamics starting from the gap on May 25 (excluding the second half of October). Moreover, the events of this week show that the median line acts as resistance.
If the price is able to hold above the USD 480 level, this could mean that the CFO's statement caused only a short-term correction, then a gradual increase along the median line would be a sign of a strong market. Otherwise, the price may continue to decline to the lower border of the channel, acting bearishly after the publication of a strong report — just like 3 months earlier.
Trade global index CFDs with zero commission and tight spreads (additional fees may apply). Open your FXOpen account now or learn more about trading index CFDs with FXOpen.
This article represents the opinion of the Companies operating under the FXOpen brand only. It is not to be construed as an offer, solicitation, or recommendation with respect to products and services provided by the Companies operating under the FXOpen brand, nor is it to be considered financial advice.
Stay ahead of the market!
Subscribe now to our mailing list and receive the latest market news and insights delivered directly to your inbox.


Latest articles

AI Valuations Are Back in the Spotlight
Artificial intelligence remains the dominant investment theme of 2026, but investors are increasingly questioning whether AI stock valuations are keeping pace with reality.
💰 Big Tech continues to invest at an unprecedented scale, with hyperscaler AI spending projected to exceed $800

AUD/CAD: Months of Indecision — Is a Breakout Finally Coming?
The Australian dollar has clawed back most of its end-of-June losses, when it touched three-month lows against the greenback amid escalating Middle East tensions. Since then, sentiment has improved: the RBA's Assistant Governor Sarah Hunter signalled the board stands ready

USD/JPY: Battling at the Top of the Triangle
On 3 July, Japan's Finance Minister, Satsuki Katayama, stated that the Ministry of Finance remains in close contact with US authorities regarding developments in USD/JPY as the yen traded near its weakest level in almost 40 years. Similar verbal