


Market Analysis: Oil Surges to a New High of the Year
FXOpen

As the chart shows, the day before yesterday, a barrel of WTI cost USD 87.87, but this morning, the price exceeded the level of USD 93. That is, the growth was more than 6% in just 2 days.
The main driver of such growth remains the voluntary reduction in oil production by OPEC+ countries. Added to this was the market's reaction to yesterday's news about the reduction in oil reserves in the United States (expected = -0.7 million barrels, actual = -2.2 million). Inventories are approaching historical lows, according to Reuters. Probably, the US authorities, by releasing oil from storage, are trying to reduce the impact of its high price on inflation, but the graph shows that these efforts are unlikely to give the desired result.
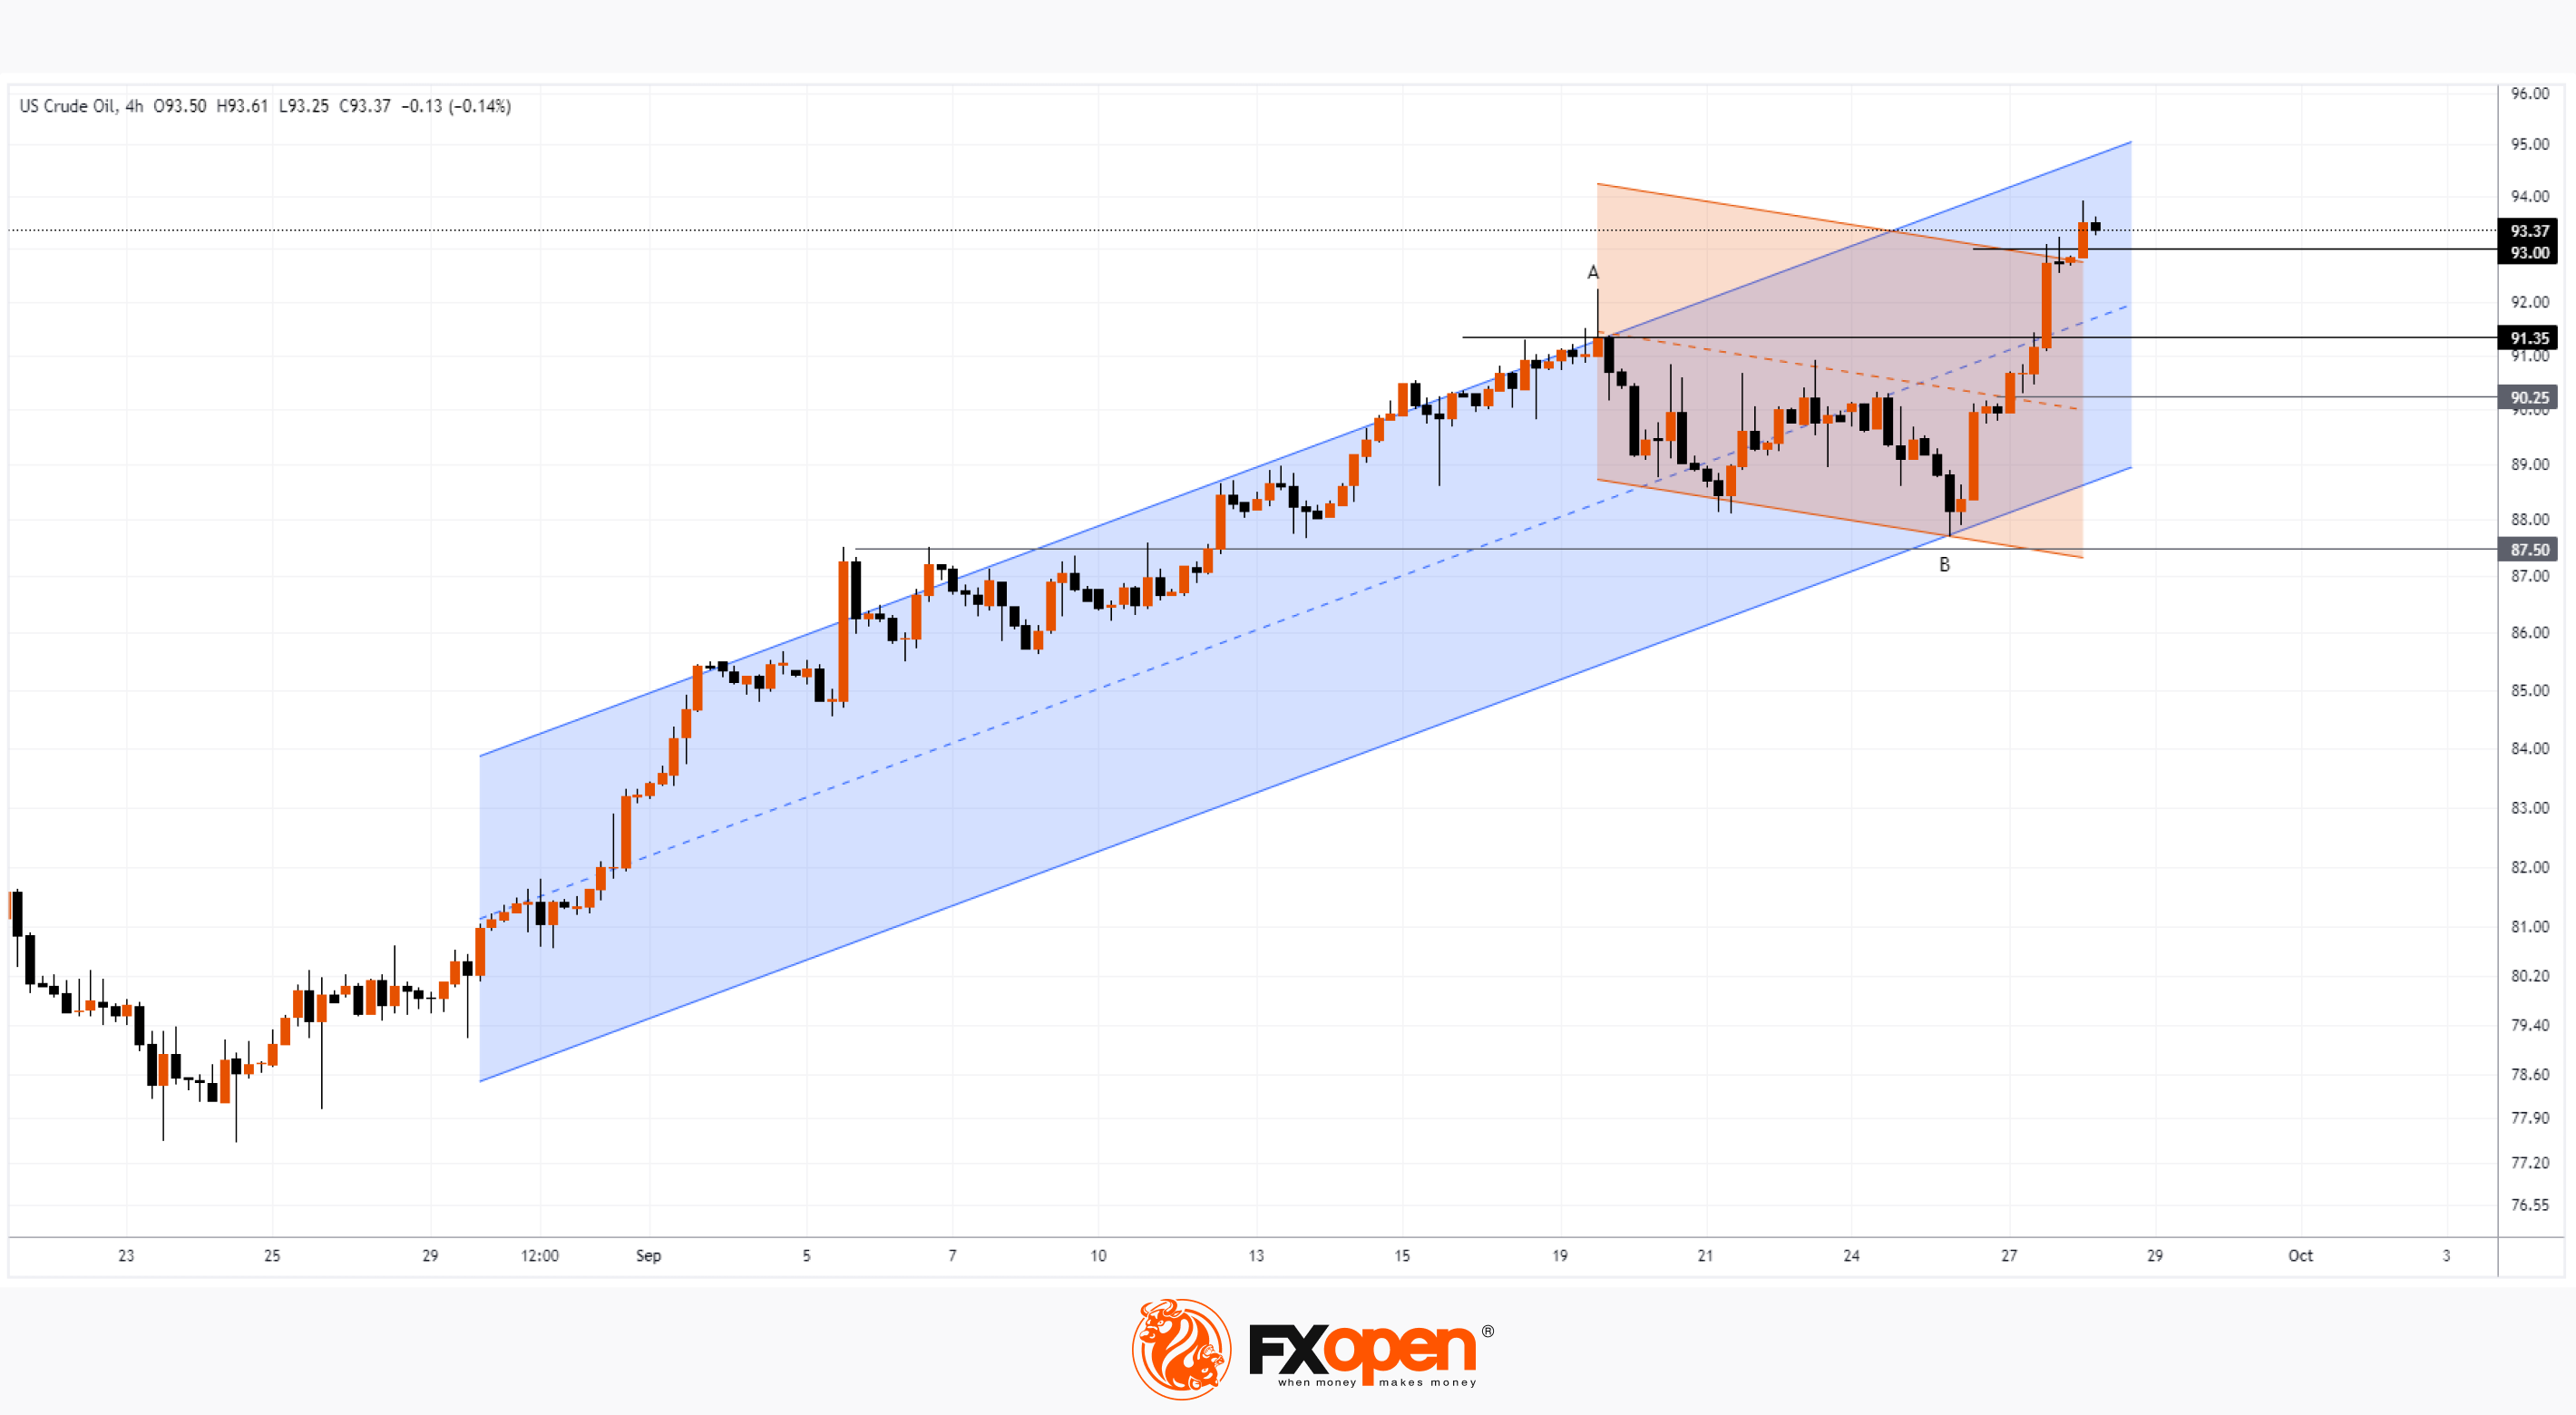
The A→B decline in oil prices observed since September 19 was merely a correction (shown in red) within a longer-term uptrend (shown in blue). Wherein:
→ the price sharply pushed off from the lower border of the blue channel around 87.5 - we wrote about this scenario earlier;
→ after a short respite, it broke through the median line of the red channel at around 90.25;
→ confidently overcame the level of 91.35, where growth clearly slowed down 10 days ago when approaching point A;
→ exceeded the upper limit of the red channel.
Now it is important for the bulls to gain a foothold at the achieved highs around USD 93. But if the upward impulse has not exhausted itself, then we may witness continued growth towards the upper border of the blue channel.
On the other hand: overbought market, the desire to lock in profits from long positions before the weekend, a possible reaction at the level of statements from the US authorities — all these can become factors contributing to the formation of a correction (for example, to the median line of the blue channel).
Start trading commodity CFDs with tight spreads (additional fees may apply). Open your trading account now or learn more about trading commodity CFDs with FXOpen.
This article represents the opinion of the Companies operating under the FXOpen brand only. It is not to be construed as an offer, solicitation, or recommendation with respect to products and services provided by the Companies operating under the FXOpen brand, nor is it to be considered financial advice.
Stay ahead of the market!
Subscribe now to our mailing list and receive the latest market news and insights delivered directly to your inbox.


Latest articles

Dow Jones (DJIA): Consolidation Beyond the Trend
Federal Reserve Chair Kevin Warsh testified before Congress on 14–15 July, reaffirming the Fed's commitment to bringing inflation back to target while providing no clear guidance on the future path of interest rates. Meanwhile, June inflation data came in

European Currencies Strengthen Ahead of Key Macroeconomic Releases
EUR/USD and GBP/USD continue to recover moderately following the recent weakening of the US dollar. European currencies have been supported by expectations that US inflationary pressures will continue to ease after softer-than-expected CPI and PPI data, reinforcing market

Brent Crude Oil: From Ceasefire to Crossfire — What's Next?
Just weeks ago, traders were pricing in peace. Now they're pricing in war again—and that reversal says everything about how fragile the current Middle East calm really is.
Brent crude has surged to $86 a barrel, its highest level