


Market Analysis: Rising Bond Yields Are Driving Down Price of Gold
FXOpen

The yield on 10-year bonds exceeded 4.5% per annum – a 16-year high. The demand for them was promoted by:
→ tough statements from the Fed last week that the high base interest rate will remain as long as necessary. Moreover, Minneapolis Fed President Neel Kashkari said he expects another increase;
→ concerns related to the likelihood of a US government shutdown on October 1. At the same time, Moody's issued a stern warning, jeopardizing the country's triple-A rating.
It can be assumed that investors choose bonds when forming a portfolio of protective assets. This puts pressure on the gold, which “loses its shine” in their eyes.
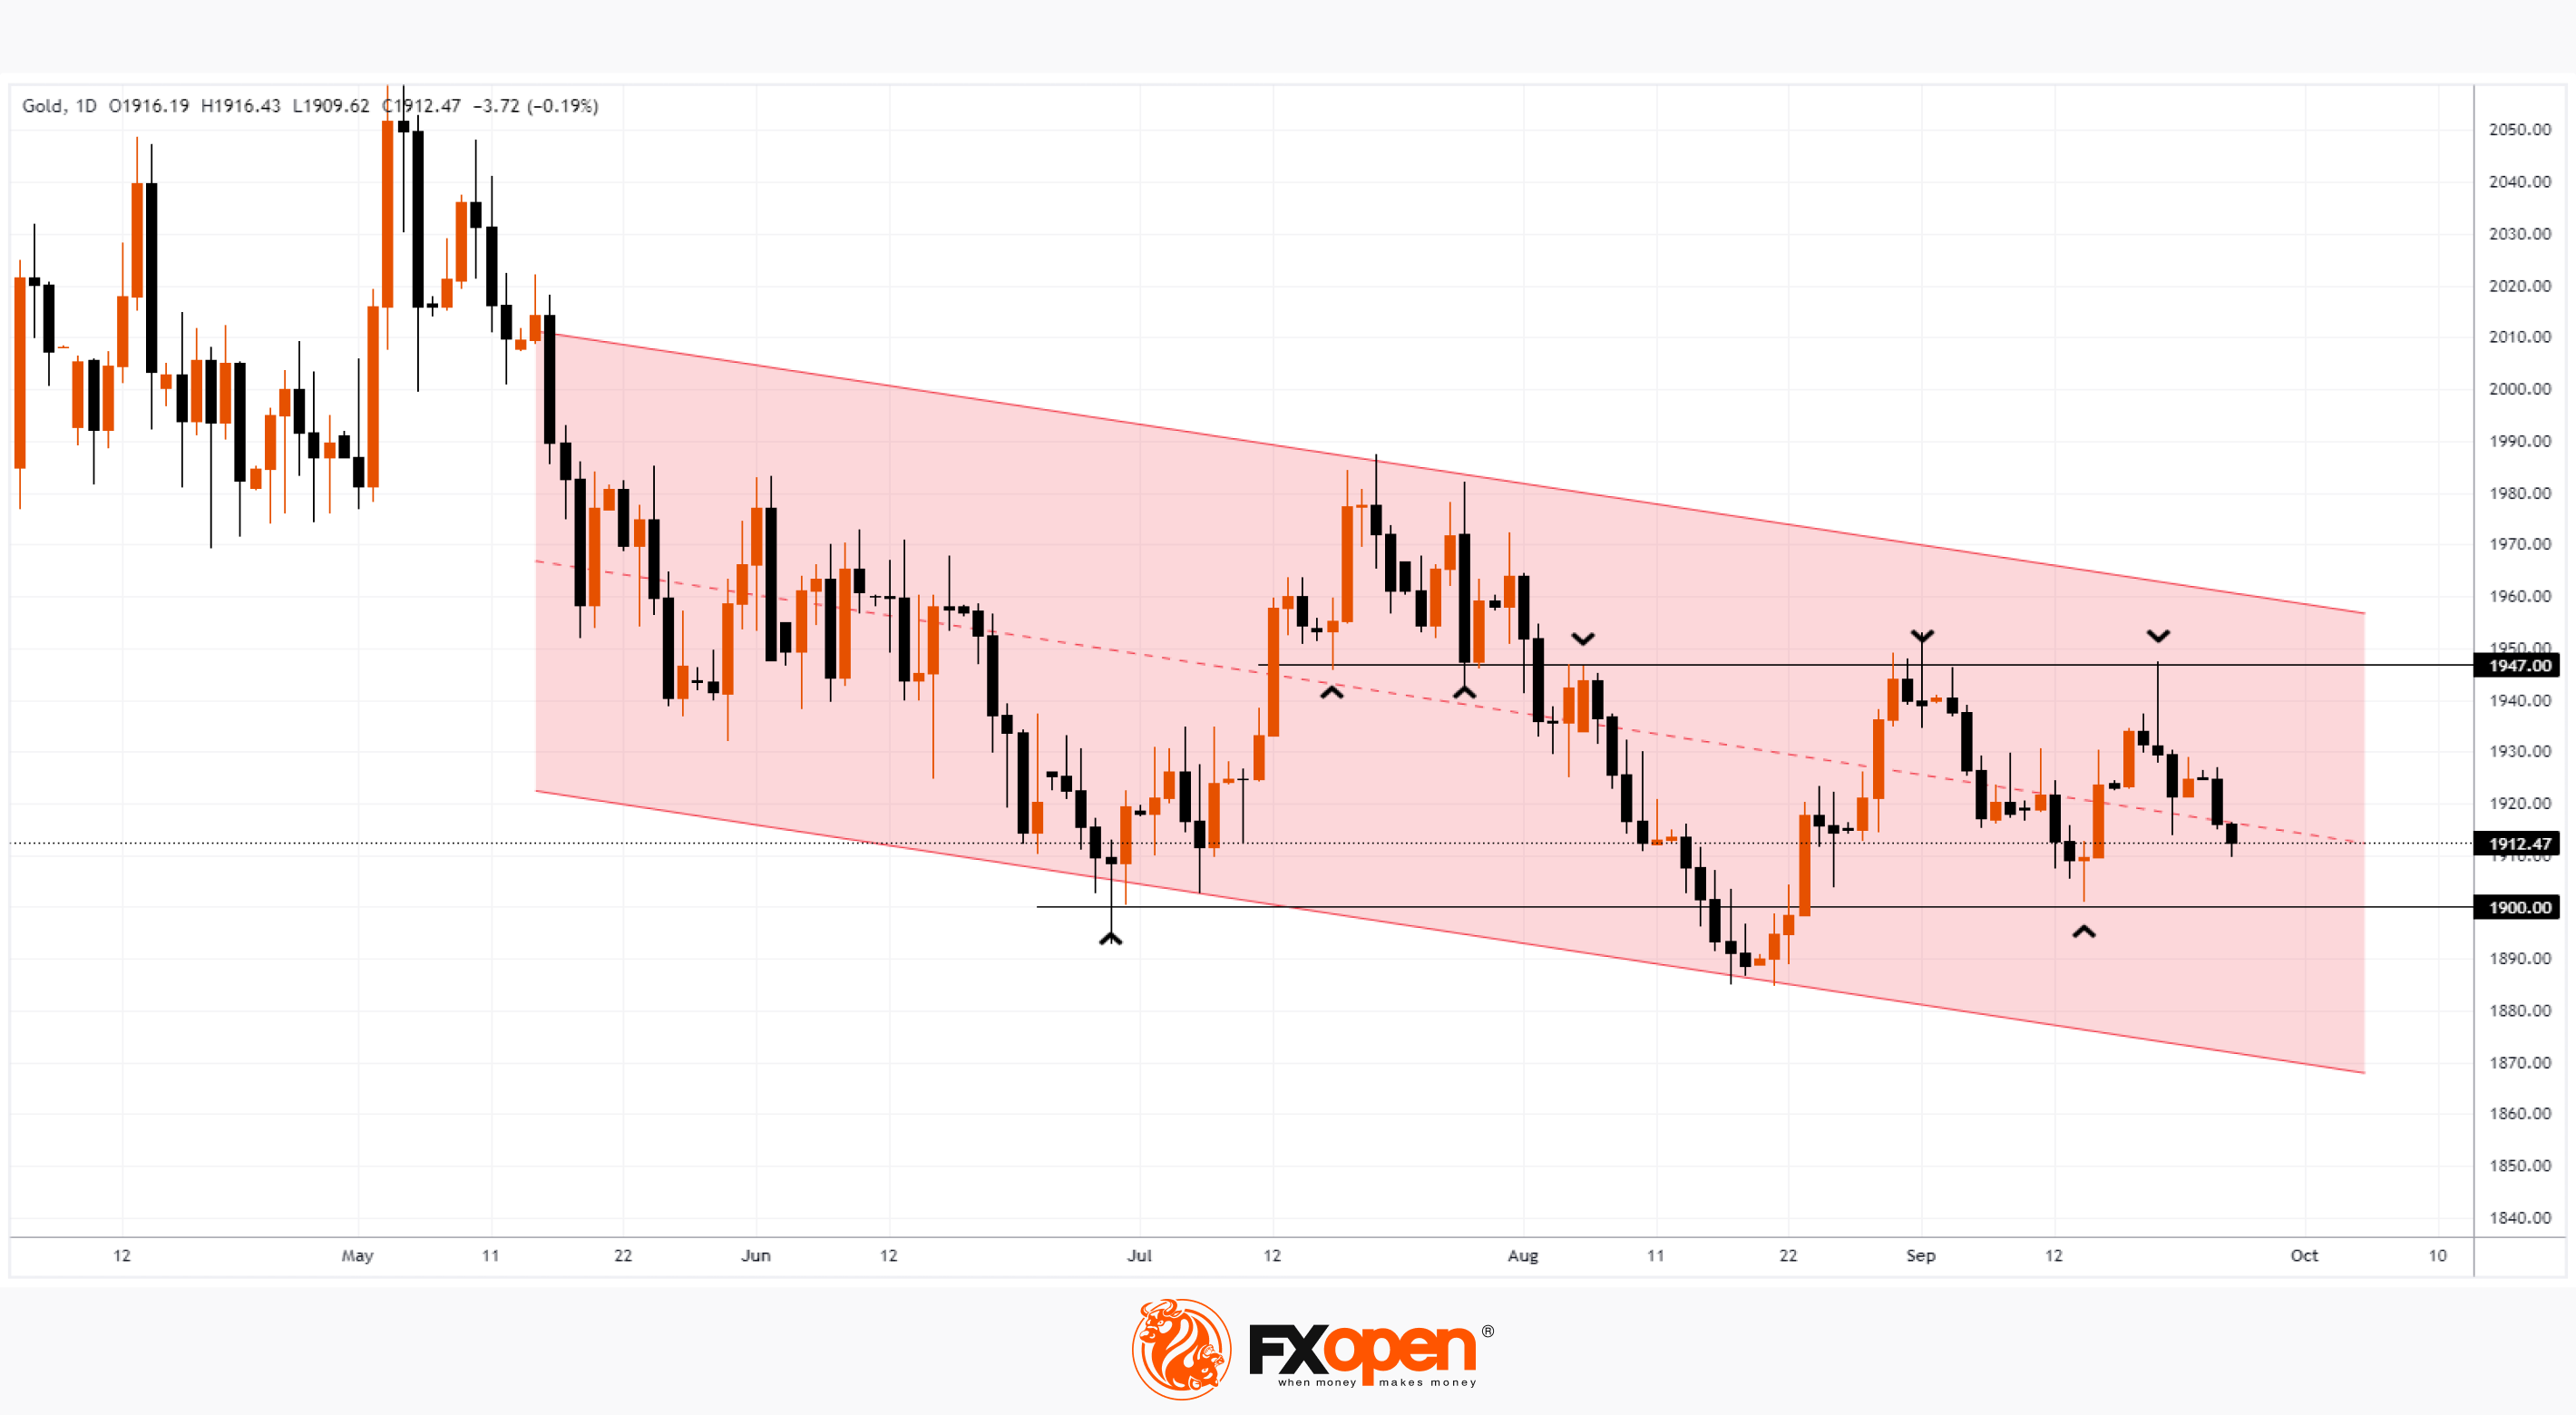
Thus, the XAU/USD daily chart shows that the price of gold continues the downward trend that has been going on since spring. Wherein:
→ the price of gold actively interacts with the level of 1,947. In July, this level acted as support, but in August this status changed. And the candle of September 20 confirms the dominance of the bears — the price failed to stay at the achieved heights. It was more like an intraday emotional movement that did not reflect the intrinsic value of gold;
→ so far, the price is near the median line of the channel, where supply and demand tend to balance, so this reduces the likelihood of sharp spikes in volatility;
→ But the psychological level of USD 1,900 per ounce is getting closer. But if in July the price rebounded sharply from it, then in August it made a delay, falling below 1,900. If the pressure on gold continues, then the bears may attempt a new attack on the psychological level and it is possible that the price may drop to the lower limit by the end of the year downward channel.
Start trading commodity CFDs with tight spreads (additional fees may apply). Open your trading account now or learn more about trading commodity CFDs with FXOpen.
This article represents the opinion of the Companies operating under the FXOpen brand only. It is not to be construed as an offer, solicitation, or recommendation with respect to products and services provided by the Companies operating under the FXOpen brand, nor is it to be considered financial advice.
Stay ahead of the market!
Subscribe now to our mailing list and receive the latest market news and insights delivered directly to your inbox.


Latest articles

Weekly Market Insights with Gary Thomson: The Week of Central Banks and Earnings
In this video, we’ll explore the key economic events and market trends, shaping the financial landscape. Get ready for insights into financial markets to help you navigate the week ahead. Let’s dive in!
In this episode of Market

Intel at a Crossroads: Earnings Beat Meets Technical Resistance
Intel has just delivered its strongest quarter in over fifteen years, and the market reaction says it all. Q2 2026 revenue surged 25% year-over-year to $16.1 billion, crushing the consensus estimate of $14.42 billion, while adjusted EPS of

Tesla: Complex Range Structure Breaks Down Following Quarterly Earnings
Tesla released its Q2 2026 results after the market closed on 22 July. Revenue increased 26% year-on-year to $28.24 billion, while vehicle deliveries reached a record 480,126 units. However, operating margin fell sharply to 1.4%, down from