


Market Analysis: S&P 500 Declines in August after 5 Consecutive Months of Gains
FXOpen
According to statistics over the past 25 years, the average growth of the S&P 500 index is 7.8% per year. But from the beginning of 2023 to August 1, the index rose by about 19%, so a noticeable correction in size was overdue.
The decline from August 1st to the month's low was about 2/3 of the previous rise — a perfectly acceptable proportion to blow off steam from the market, which was indicated by the RSI overbought in July (while forming a divergence pattern warning that the rally has exhausted ).
An important result of the summer was that analysts in the media began to mention the recession scenario less and less – market participants believe in a “soft landing” and that the Fed is controlling the situation with high inflation, given the alarming signals from the labor market.
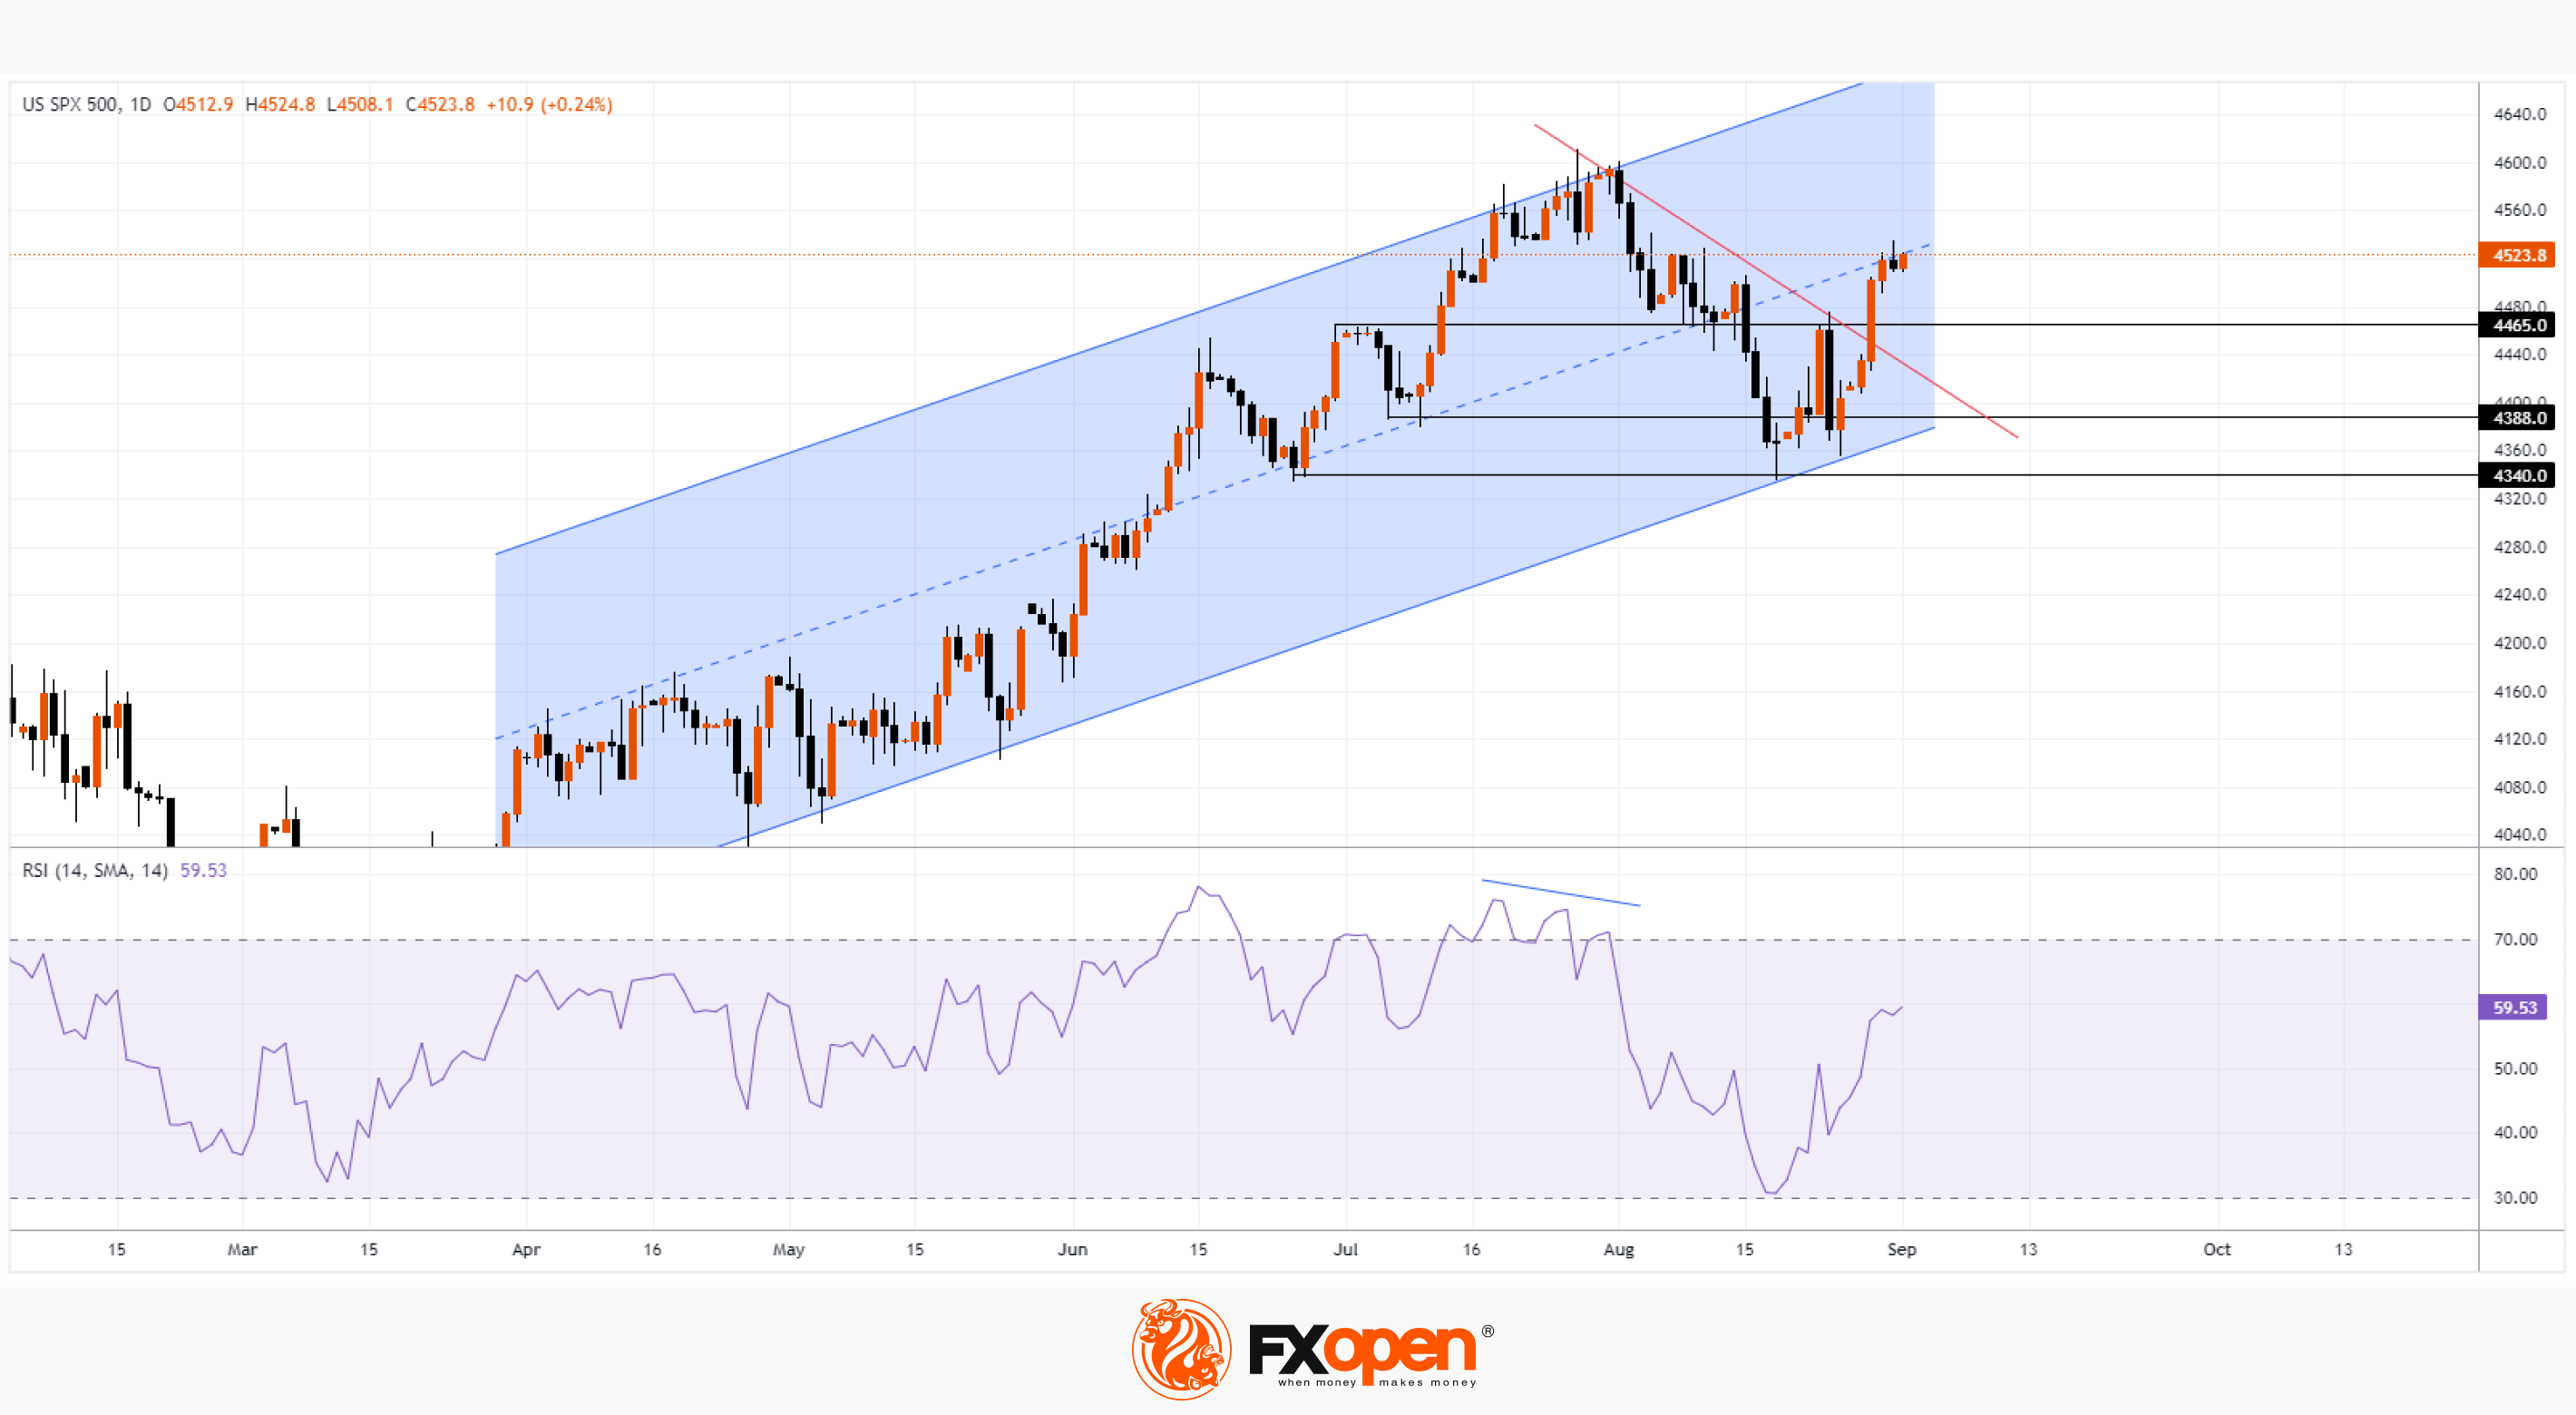
What will happen in autumn? Traditionally, these are months of high volatility, with the S&P 500 having chances to try to hit a new high for the year after a correction that appears to have formed in August. This is indicated by bullish facts from the chart:
→ The price of the S&P 500 has found support at the lower boundary of the parallel channel.
→ The price rebounded from the support level of 4,340.
→ The price is above significant levels 4,388 and 4,465.
→ The price has broken the bearish trend line (shown in red).
→ The price may consolidate near the median line of the channel, where supply and demand may balance each other in total before the September Fed meeting.
Trade global index CFDs with zero commission and tight spreads (additional fees may apply). Open your FXOpen account now or learn more about trading index CFDs with FXOpen.
This article represents the opinion of the Companies operating under the FXOpen brand only. It is not to be construed as an offer, solicitation, or recommendation with respect to products and services provided by the Companies operating under the FXOpen brand, nor is it to be considered financial advice.
Stay ahead of the market!
Subscribe now to our mailing list and receive the latest market news and insights delivered directly to your inbox.


Latest articles

EUR/USD Eyes Gains As USD/CHF Weakness Deepens Again
EUR/USD started a fresh increase above 1.1700 and 1.1720. USD/CHF declined further and is now struggling below 0.7835.
Important Takeaways for EUR/USD and USD/CHF Analysis Today
· The Euro started a decent increase from

Apple: Earnings Day Above the Activity Zone
On 30 April, after the market close, Apple Inc. will release its financial results for the second quarter of fiscal 2026. The consensus forecast, based on estimates from 31 analysts, points to revenue of around $109.7 billion, with expected

USD/JPY and USD/CHF Near Key Levels: The Dollar Supported by the Fed
The US dollar continues to trend upwards following the Federal Reserve meeting, drawing support from the regulator’s moderately hawkish stance and comments by Jerome Powell. Markets interpret the Fed’s rhetoric as a signal that restrictive policy is likely