


Market Analysis: The Price of Oil Sets Maximum of the Year
FXOpen

Yesterday, the price of WTI oil rose above USD 85.50 per barrel. This has not happened since November 2022.
On August 24, we wrote that the price of oil could find support for growth from the lower border of the rising channel, as well as from the level of USD 78.50. Since then, the price of WTI oil has risen by more than 9%. Fundamentally this contributed to:
→ the policy of limiting production by OPEC+ countries;
→ expectations that the Chinese economy will recover thanks to the incentives of the authorities.
According to Trafigura, a large company trading mainly in metals and energy resources, investment in the development of the oil industry is not enough, and a price of up to USD 88 can be considered fair in the current circumstances.
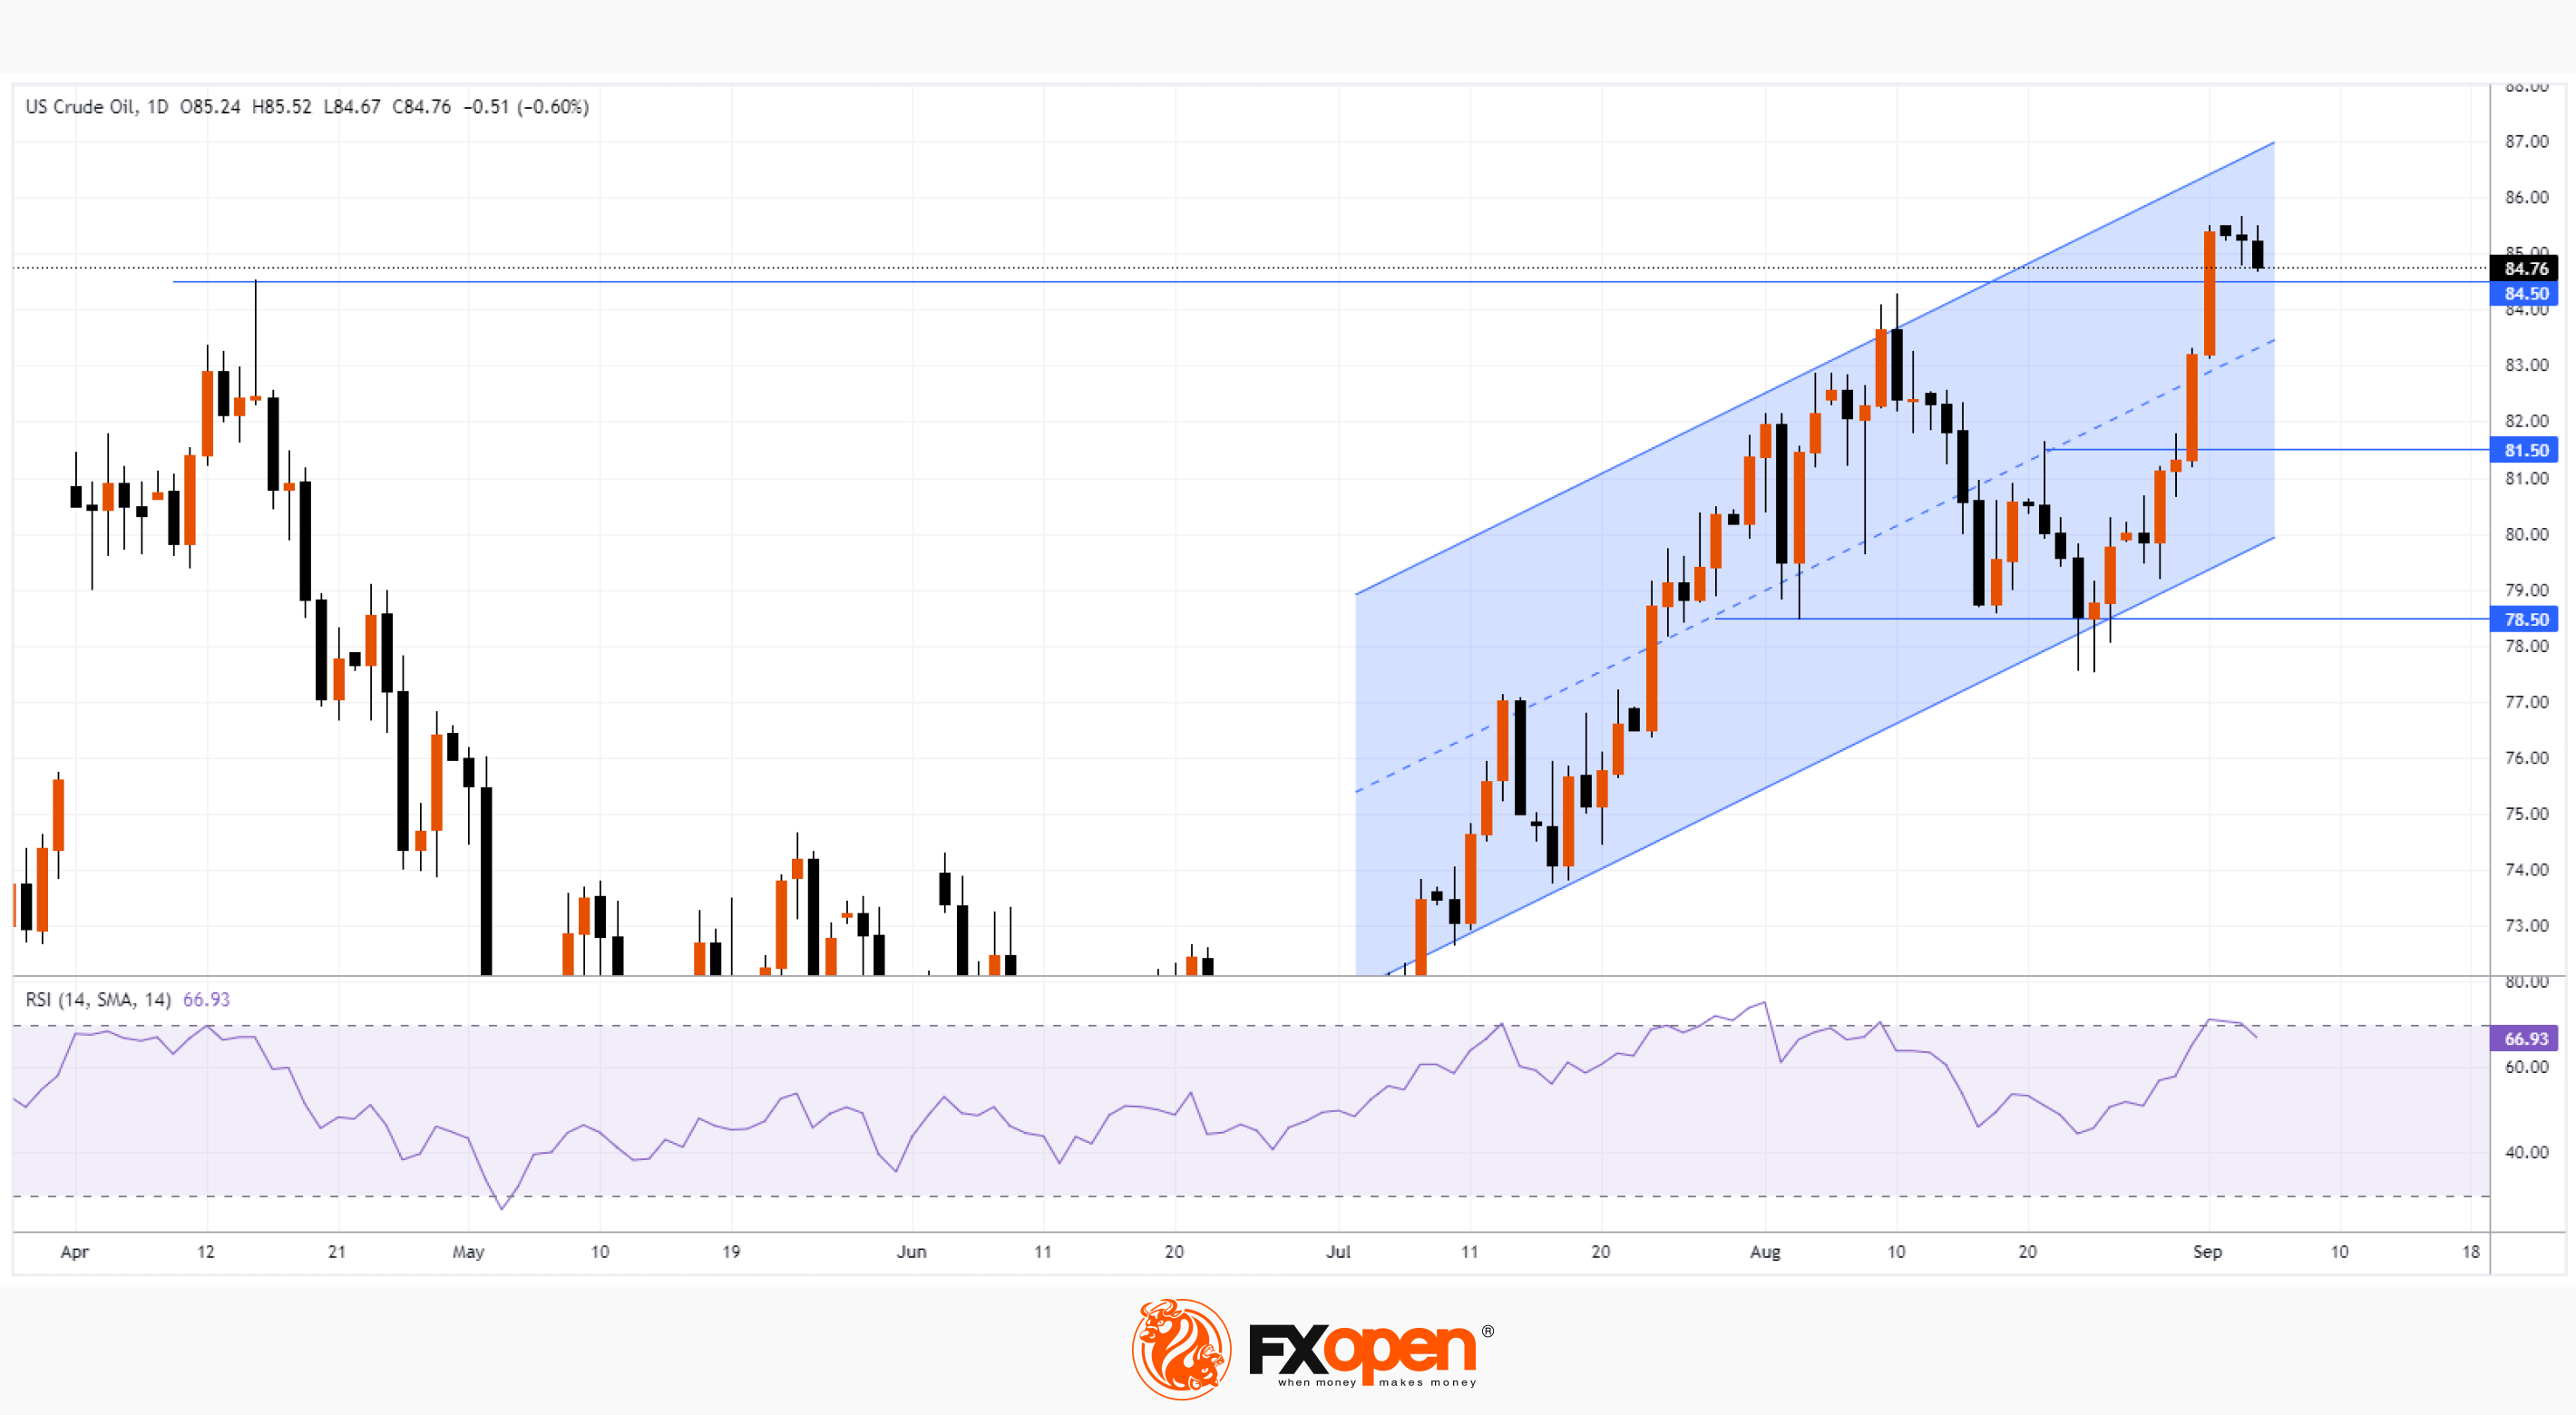
Bullish arguments:
→ the price of oil has not yet reached the upper limit of the rising channel, leaving the potential for updating the highs of the year;
→ the level at 81.50, which worked as a resistance, can now provide support;
→ support can also be provided by the median line of the uplink.
Bearish arguments:
→ rising oil prices are unfavorable for large economies, including the United States, which are struggling with high inflation. We can expect steps from governments aimed at lowering prices;
→ after 2 weeks of rapid growth (and especially on August 31 and September 1), a pullback would be a logical development for a market that is “overheated”. The RSI indicator indicates overbought.
Start trading commodity CFDs with tight spreads (additional fees may apply). Open your trading account now or learn more about trading commodity CFDs with FXOpen.
This article represents the opinion of the Companies operating under the FXOpen brand only. It is not to be construed as an offer, solicitation, or recommendation with respect to products and services provided by the Companies operating under the FXOpen brand, nor is it to be considered financial advice.
Stay ahead of the market!
Subscribe now to our mailing list and receive the latest market news and insights delivered directly to your inbox.


Latest articles

AI Valuations Are Back in the Spotlight
Artificial intelligence remains the dominant investment theme of 2026, but investors are increasingly questioning whether AI stock valuations are keeping pace with reality.
💰 Big Tech continues to invest at an unprecedented scale, with hyperscaler AI spending projected to exceed $800

AUD/CAD: Months of Indecision — Is a Breakout Finally Coming?
The Australian dollar has clawed back most of its end-of-June losses, when it touched three-month lows against the greenback amid escalating Middle East tensions. Since then, sentiment has improved: the RBA's Assistant Governor Sarah Hunter signalled the board stands ready

USD/JPY: Battling at the Top of the Triangle
On 3 July, Japan's Finance Minister, Satsuki Katayama, stated that the Ministry of Finance remains in close contact with US authorities regarding developments in USD/JPY as the yen traded near its weakest level in almost 40 years. Similar verbal