


Market Analysis: The Price of WTI Oil Falls to August Minimum
FXOpen

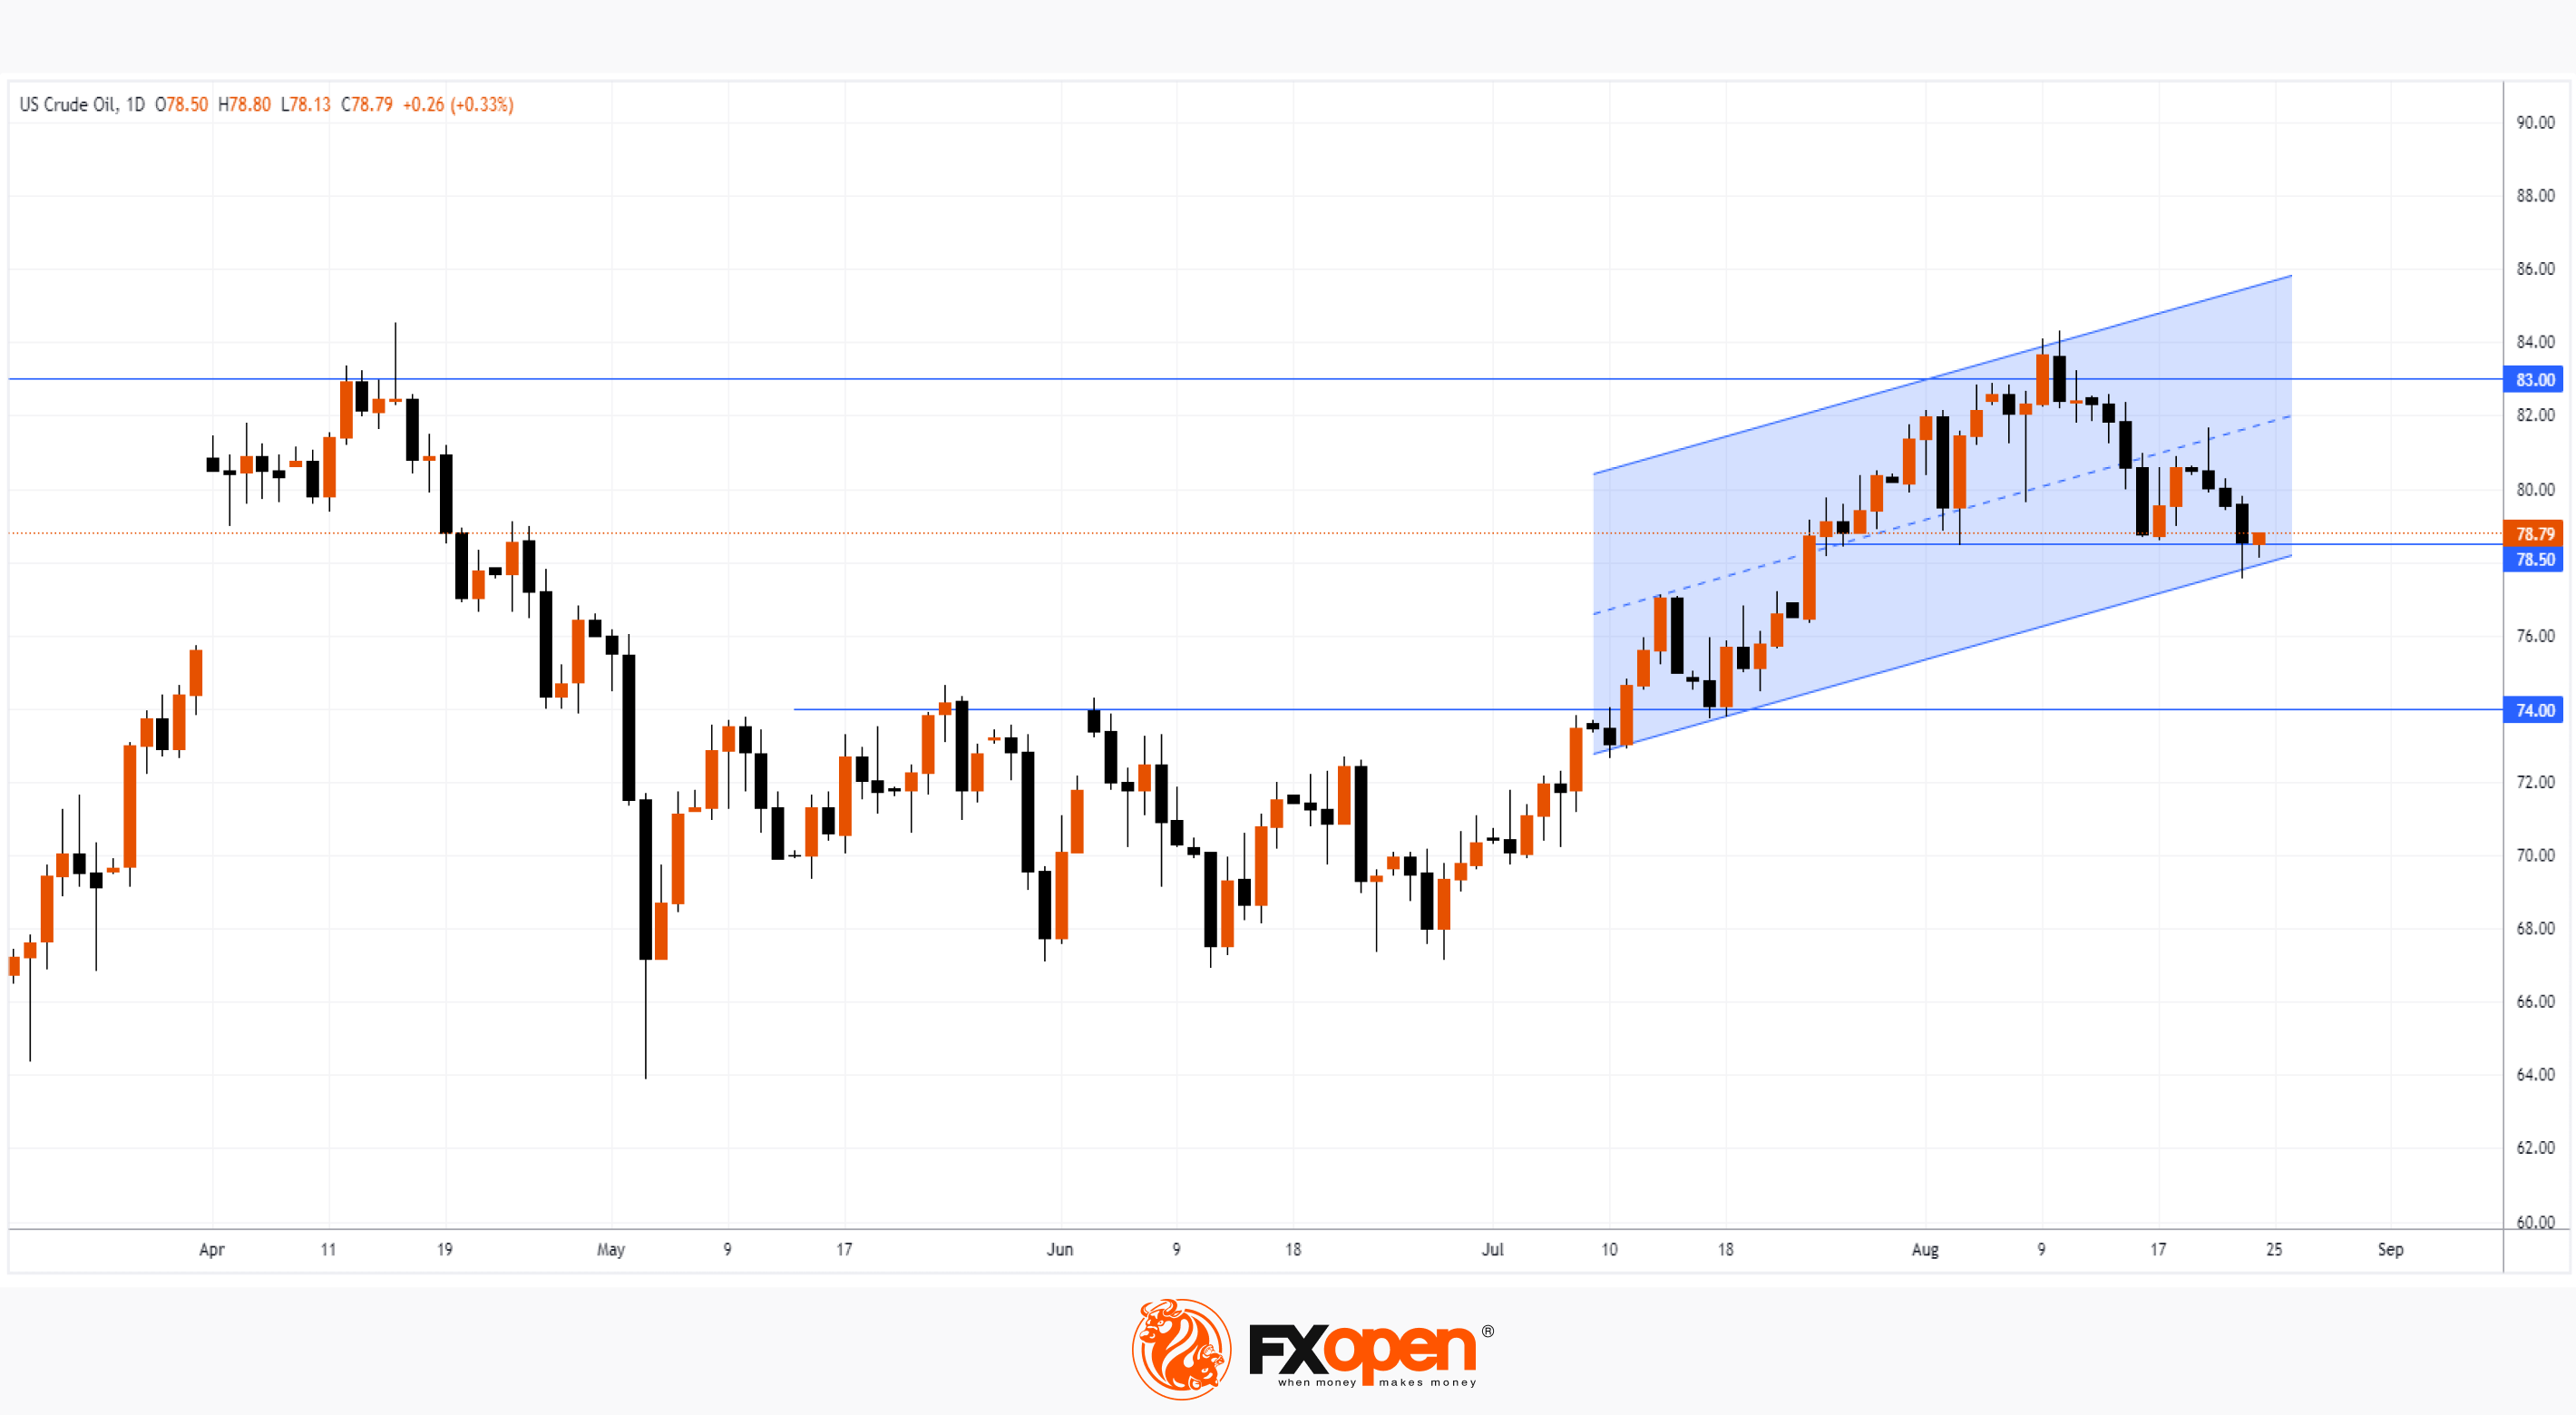
As the chart shows, US Crude Oil fell below USD 78 yesterday for the first time since July 25. This was facilitated by:
→ fears of a crisis that could follow from the collapse of the Chinese property developer Evergrande;
→ alarming PMI data from different economies. Japan reported a contraction in manufacturing activity for the third month in a row. Business activity in the euro area also fell more than expected, especially in Germany. Business activity in the US in August approached the point of stagnation, while growth was the weakest since February.
Bullish arguments:
→ The market has been bullish since July. And the current rollback from the top of July is just a correction.
→ The price of WTI Crude may find support from the lower border of the rising channel, as well as from the level of USD 78.50, from which the price has already formed bullish reversals in August.
→ The level of USD 74 looks like a reliable support.
Bearish arguments:
→ The USD 83 level has served as strong resistance throughout the year. This may be due to the fact that increasing the price above is not beneficial for governments and central banks that are fighting inflation.
→ A candle with a long upper shadow on August 21 (followed by 2 more bearish candles) indicates bearish activity.
Start trading commodity CFDs with tight spreads (additional fees may apply). Open your trading account now or learn more about trading commodity CFDs with FXOpen.
This article represents the opinion of the Companies operating under the FXOpen brand only. It is not to be construed as an offer, solicitation, or recommendation with respect to products and services provided by the Companies operating under the FXOpen brand, nor is it to be considered financial advice.
Stay ahead of the market!
Subscribe now to our mailing list and receive the latest market news and insights delivered directly to your inbox.


Latest articles

AI Valuations Are Back in the Spotlight
Artificial intelligence remains the dominant investment theme of 2026, but investors are increasingly questioning whether AI stock valuations are keeping pace with reality.
💰 Big Tech continues to invest at an unprecedented scale, with hyperscaler AI spending projected to exceed $800

AUD/CAD: Months of Indecision — Is a Breakout Finally Coming?
The Australian dollar has clawed back most of its end-of-June losses, when it touched three-month lows against the greenback amid escalating Middle East tensions. Since then, sentiment has improved: the RBA's Assistant Governor Sarah Hunter signalled the board stands ready

USD/JPY: Battling at the Top of the Triangle
On 3 July, Japan's Finance Minister, Satsuki Katayama, stated that the Ministry of Finance remains in close contact with US authorities regarding developments in USD/JPY as the yen traded near its weakest level in almost 40 years. Similar verbal