


FXOpen

The reason for the growth is the increase in the target price for TSLA shares by analysts at Morgan Stanley from USD 250 to USD 400 (about +45% from current levels).
Analysts see huge potential in Tesla Dojo — this supercomputer is capable of processing millions of terabytes of video of real-life situations captured from more than 4 million Tesla vehicles. It is designed to train artificial intelligence models to ultimately help the driver drive a car (Full Self-Driving, FSD system). Analysts say Dojo could serve as the same catalyst as AWS services that helped drive Amazon stock higher.
After analysts at Morgan Stanley upgraded their rating, TSLA's price soared 10%, exceeding USD 270 per share.
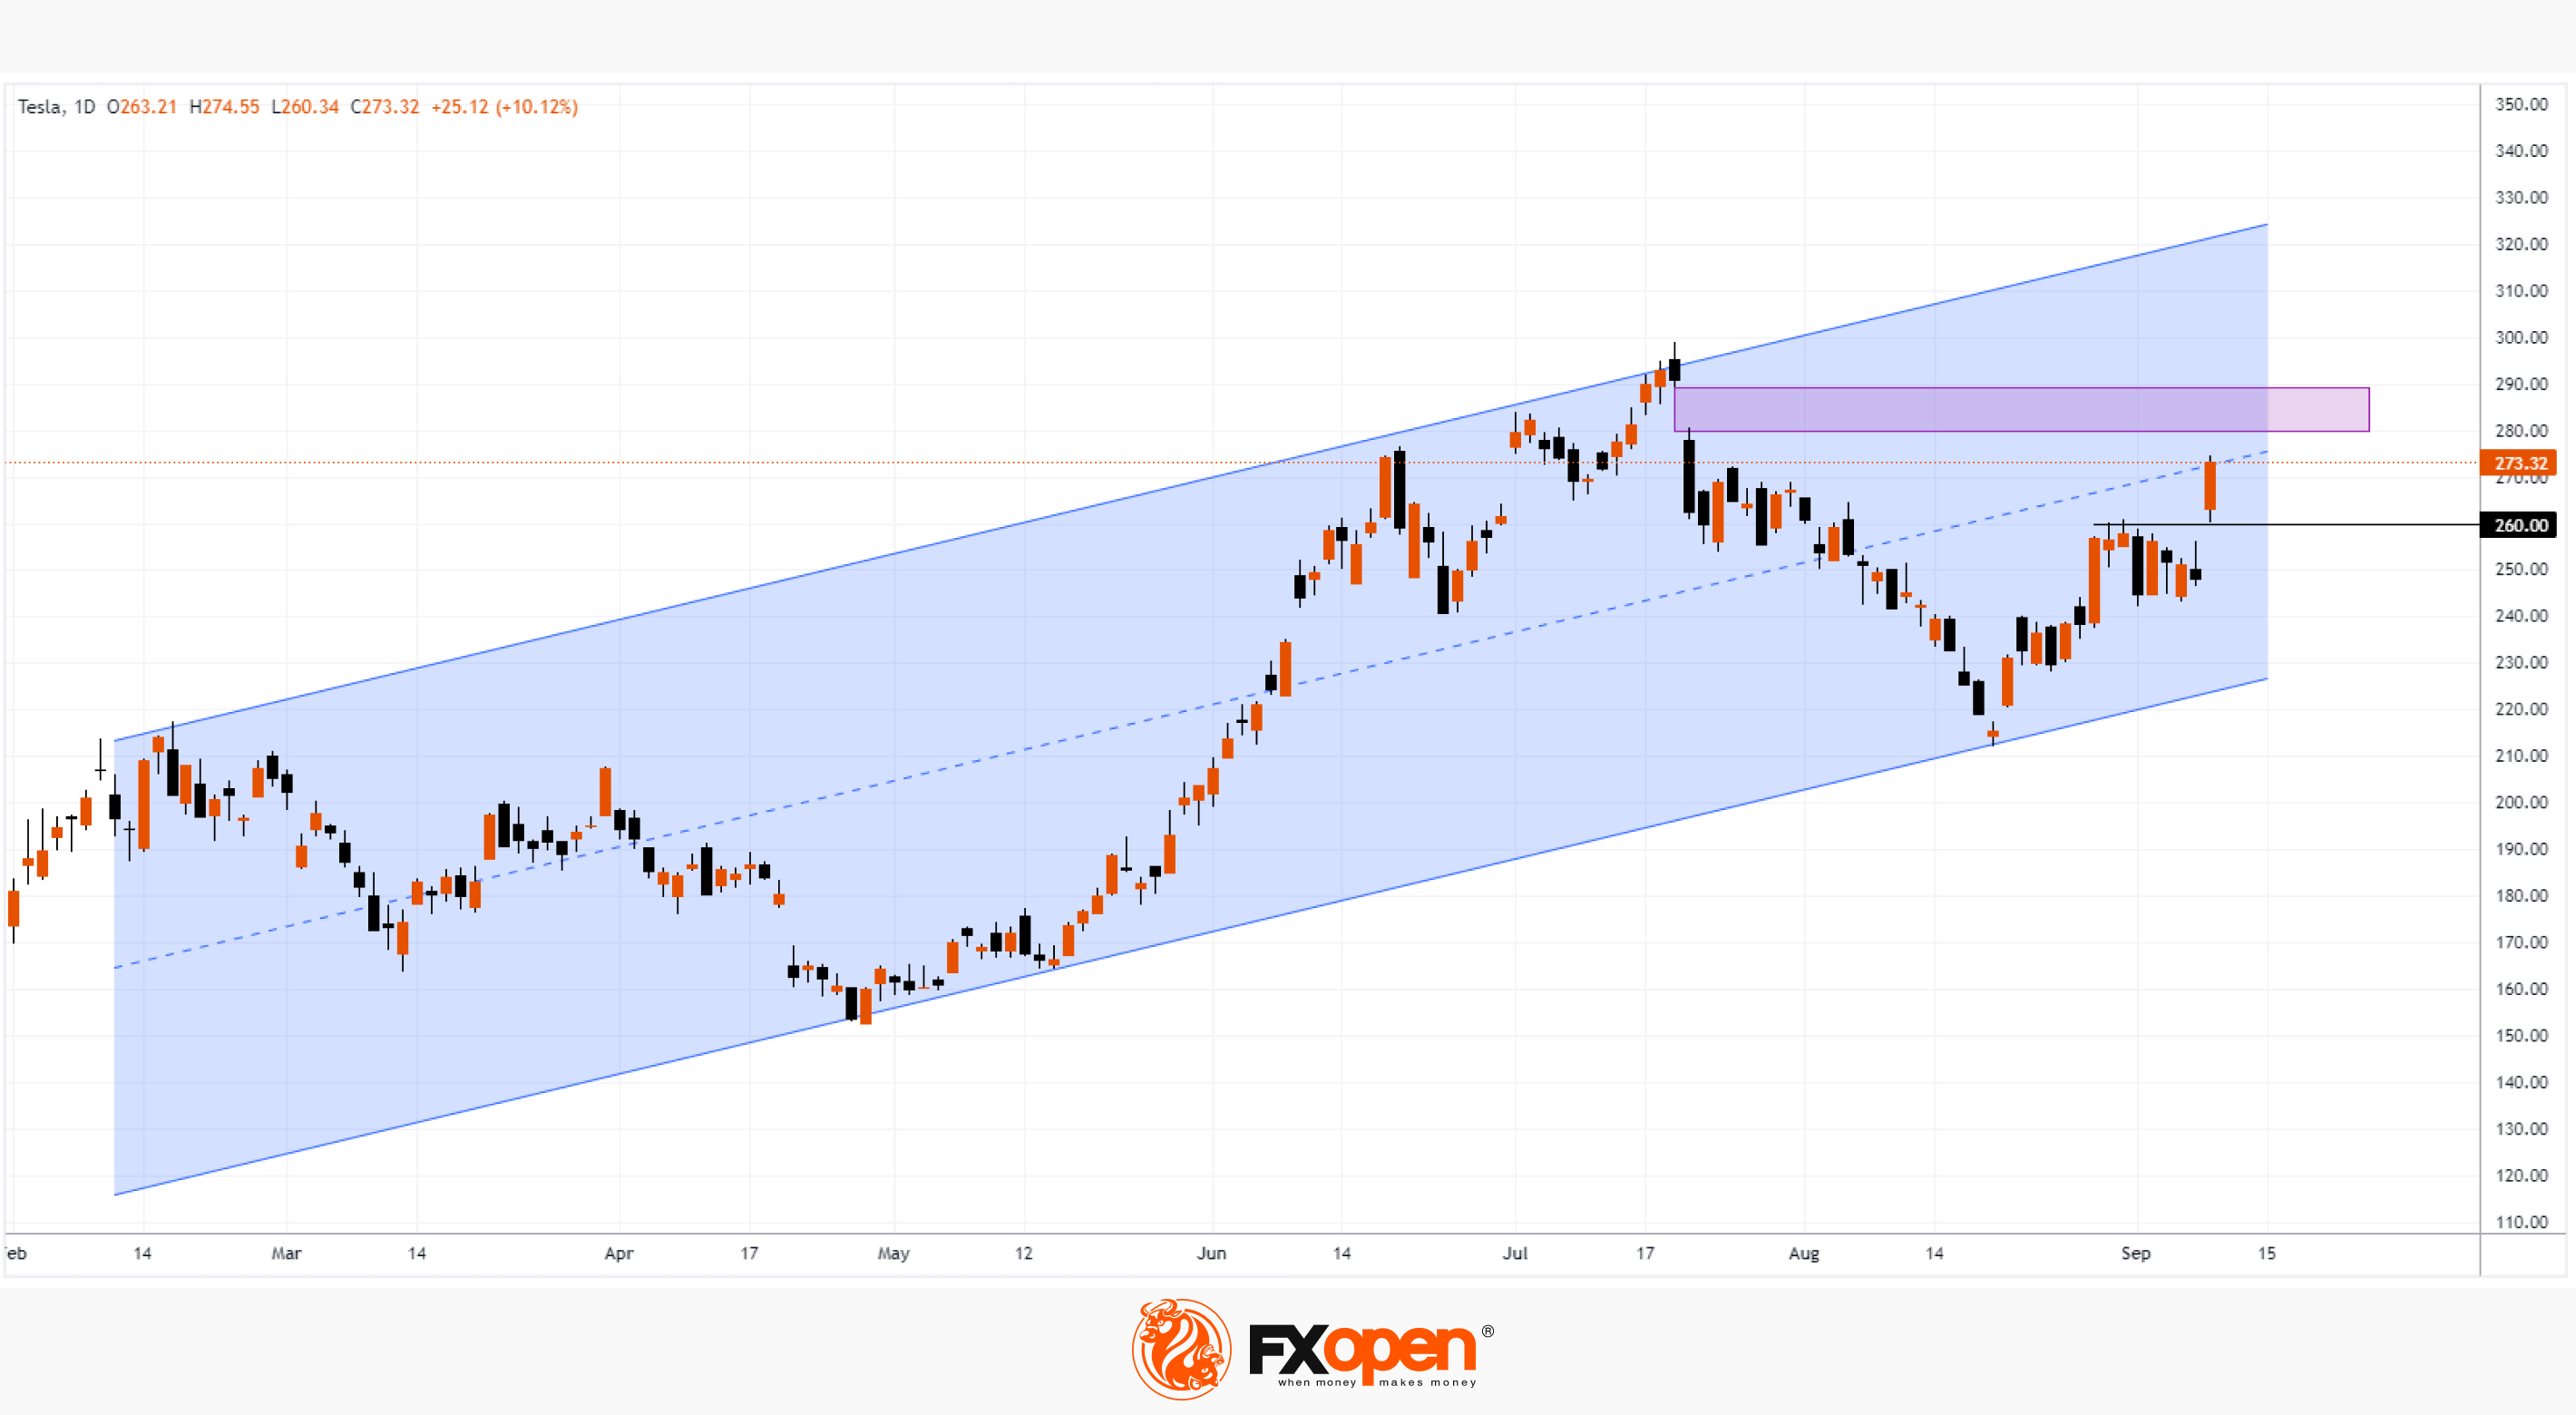
This momentum could help develop the current bullish trend that describes the trend channel in the provided chart of TSLA stock, with:
→ the level of USD 260, overcome with a gap, can now provide support;
→ after overcoming this resistance, the price reached the median line of the channel. Here, supply and demand tend to balance out — this could help the bulls gain a foothold above the breakout level of USD 260.
Bearish argument:
→ TSLA stock price has approached the bearish gap formed at the end of July. The USD 280-USD 290 area, where sell offers dominated a month and a half ago, could at least slow down the current bullish momentum.
In the coming days, the price of TSLA shares, like the entire US stock market, will be affected by news about inflation:
→ Core Price Index is scheduled to be published on Wednesday, 15:30 GMT+3.
→ The Producer Price Index is scheduled to be published on Thursday, 15:30 GMT+3. Retail sales data will also be published at this time. Be prepared for spikes in volatility.
Buy and sell stocks of the world's biggest publicly-listed companies with CFDs on FXOpen’s trading platform. Open your FXOpen account now or learn more about trading share CFDs with FXOpen.
This article represents the opinion of the Companies operating under the FXOpen brand only. It is not to be construed as an offer, solicitation, or recommendation with respect to products and services provided by the Companies operating under the FXOpen brand, nor is it to be considered financial advice.
Stay ahead of the market!
Subscribe now to our mailing list and receive the latest market news and insights delivered directly to your inbox.


Latest articles

The Real Driver Behind the Dollar Rally: Market Insights with Gary Thomson
The US dollar has been firm, but the drivers behind the move may be more complex than they first appear.
While geopolitical tension and shifts in risk sentiment play a role, current price behaviour seems increasingly influenced by inflation expectations

EUR/USD and USD/CHF Pull Back: Market Reacts to Fundamentals
European currencies have shown a recovery in recent trading sessions after their recent decline, displaying early signs of a reversal. The US dollar is weakening amid expectations surrounding upcoming US macroeconomic data, while market participants are reassessing their short-term positions

Weak Data Weigh on the Dollar: Market Awaits Trend Confirmation
The US dollar is retreating from recent highs, moving into a moderate correction after a prolonged period of gains. Pressure on the currency is building amid weaker-than-expected macroeconomic data, while market participants adopt a wait-and-see approach ahead of key labour