


FXOpen
On the morning of Friday, December 1, the UK stock market index rose to its November highs. This was facilitated by the fundamental background:
→ among the UK100 growth leaders are shares of companies mining ore and other resources. As metal prices rise and industry in China shows signs of recovery;
→ general sentiment on the world's stock markets due to the fact that the policy of raising rates pursued by the central banks of Western countries has come to an end. Fed Chairman Powell is expected to speak this evening, which could provide more evidence of this.
→ Since the UK100 index has performed weaker relative to other indices (due to higher inflation in the UK), it may be undervalued.
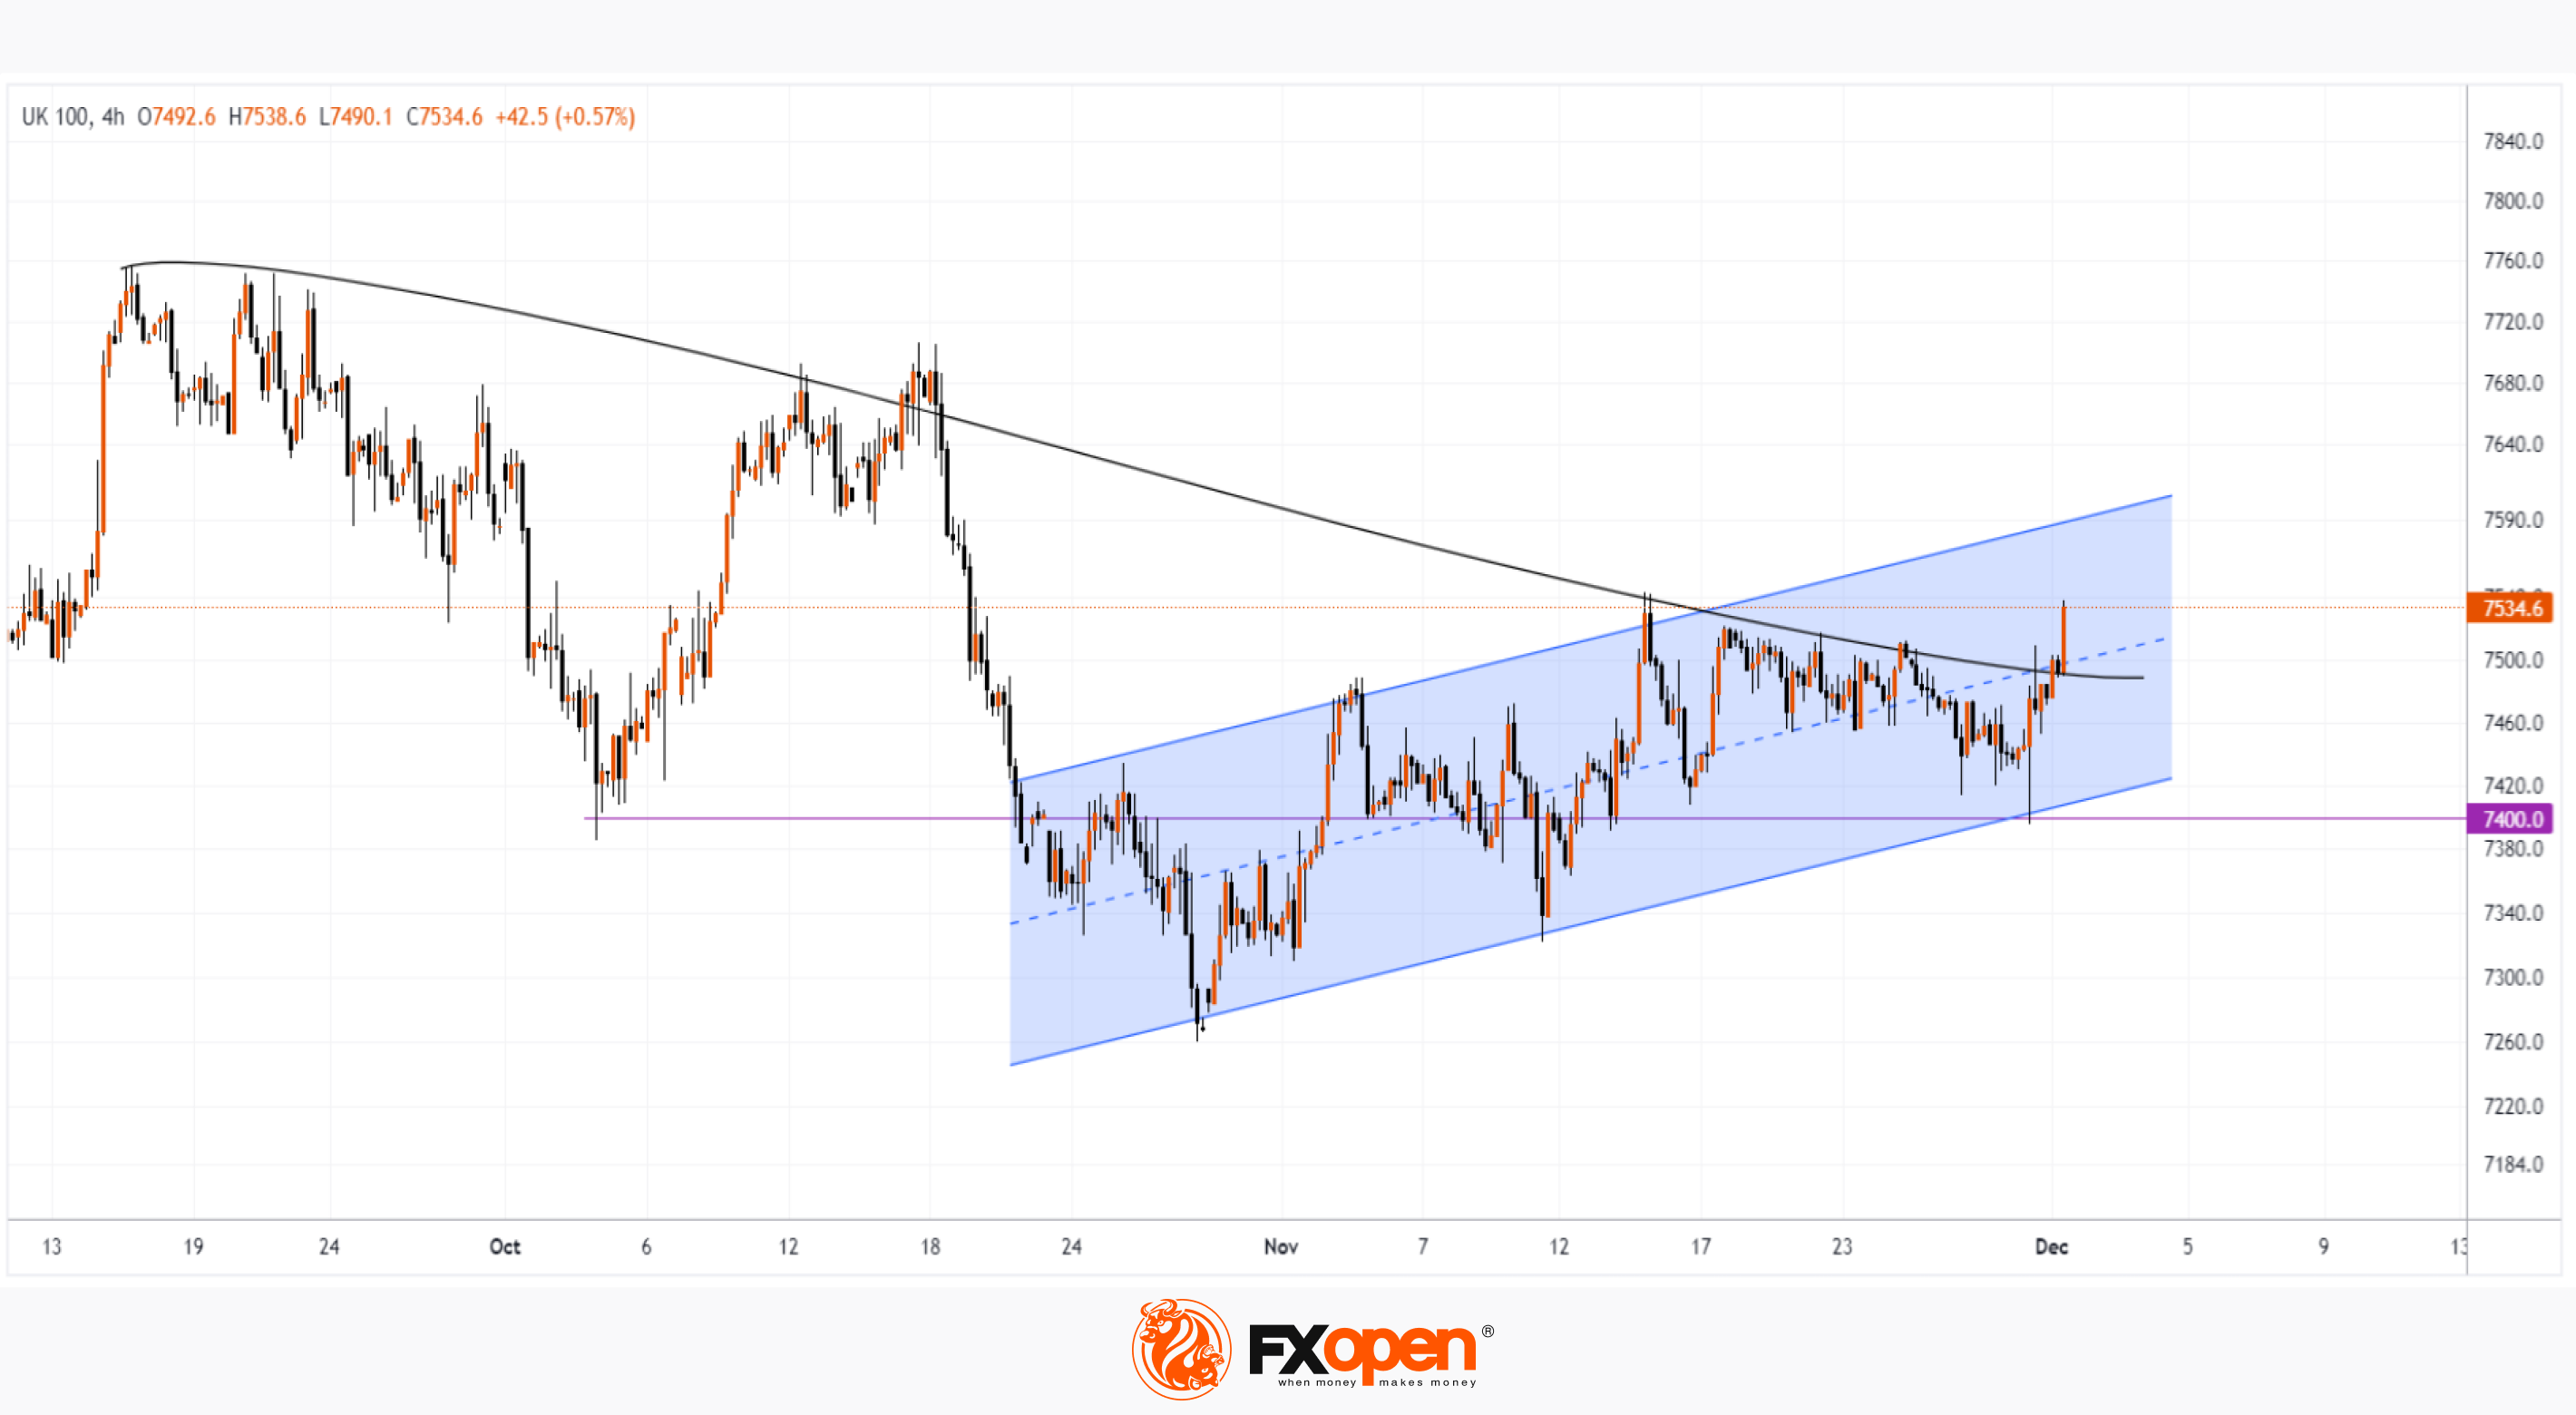
The UK100 Index chart shows signs of bullish activity:
→ on the last day of November, the price tested the psychological level of 7400, forming a long lower shadow (a sign of demand strength);
→ the price continues to develop dynamics within the November ascending channel (shown in blue). It is possible that in December we will see the price rise to its upper limit.
→ a breakdown of the black line, dating back to September, may confirm important changes in market sentiment.
Trade global index CFDs with zero commission and tight spreads (additional fees may apply). Open your FXOpen account now or learn more about trading index CFDs with FXOpen.
This article represents the opinion of the Companies operating under the FXOpen brand only. It is not to be construed as an offer, solicitation, or recommendation with respect to products and services provided by the Companies operating under the FXOpen brand, nor is it to be considered financial advice.
Stay ahead of the market!
Subscribe now to our mailing list and receive the latest market news and insights delivered directly to your inbox.


Latest articles

Consolidation Ahead of NFP: Commodity Currencies Search for Direction
Commodity-linked currencies have entered a consolidation phase following recent directional moves, as market participants adopt a wait-and-see approach ahead of key US labour market data. Current price action reflects a balance between ongoing demand for the US dollar and attempts

The Real Driver Behind the Dollar Rally: Market Insights with Gary Thomson
The US dollar has been firm, but the drivers behind the move may be more complex than they first appear.
While geopolitical tension and shifts in risk sentiment play a role, current price behaviour seems increasingly influenced by inflation expectations

EUR/USD and USD/CHF Pull Back: Market Reacts to Fundamentals
European currencies have shown a recovery in recent trading sessions after their recent decline, displaying early signs of a reversal. The US dollar is weakening amid expectations surrounding upcoming US macroeconomic data, while market participants are reassessing their short-term positions