


Market Analysis: UK100 Shows Bullish Signs
FXOpen
On the morning of Friday, December 1, the UK stock market index rose to its November highs. This was facilitated by the fundamental background:
→ among the UK100 growth leaders are shares of companies mining ore and other resources. As metal prices rise and industry in China shows signs of recovery;
→ general sentiment on the world's stock markets due to the fact that the policy of raising rates pursued by the central banks of Western countries has come to an end. Fed Chairman Powell is expected to speak this evening, which could provide more evidence of this.
→ Since the UK100 index has performed weaker relative to other indices (due to higher inflation in the UK), it may be undervalued.
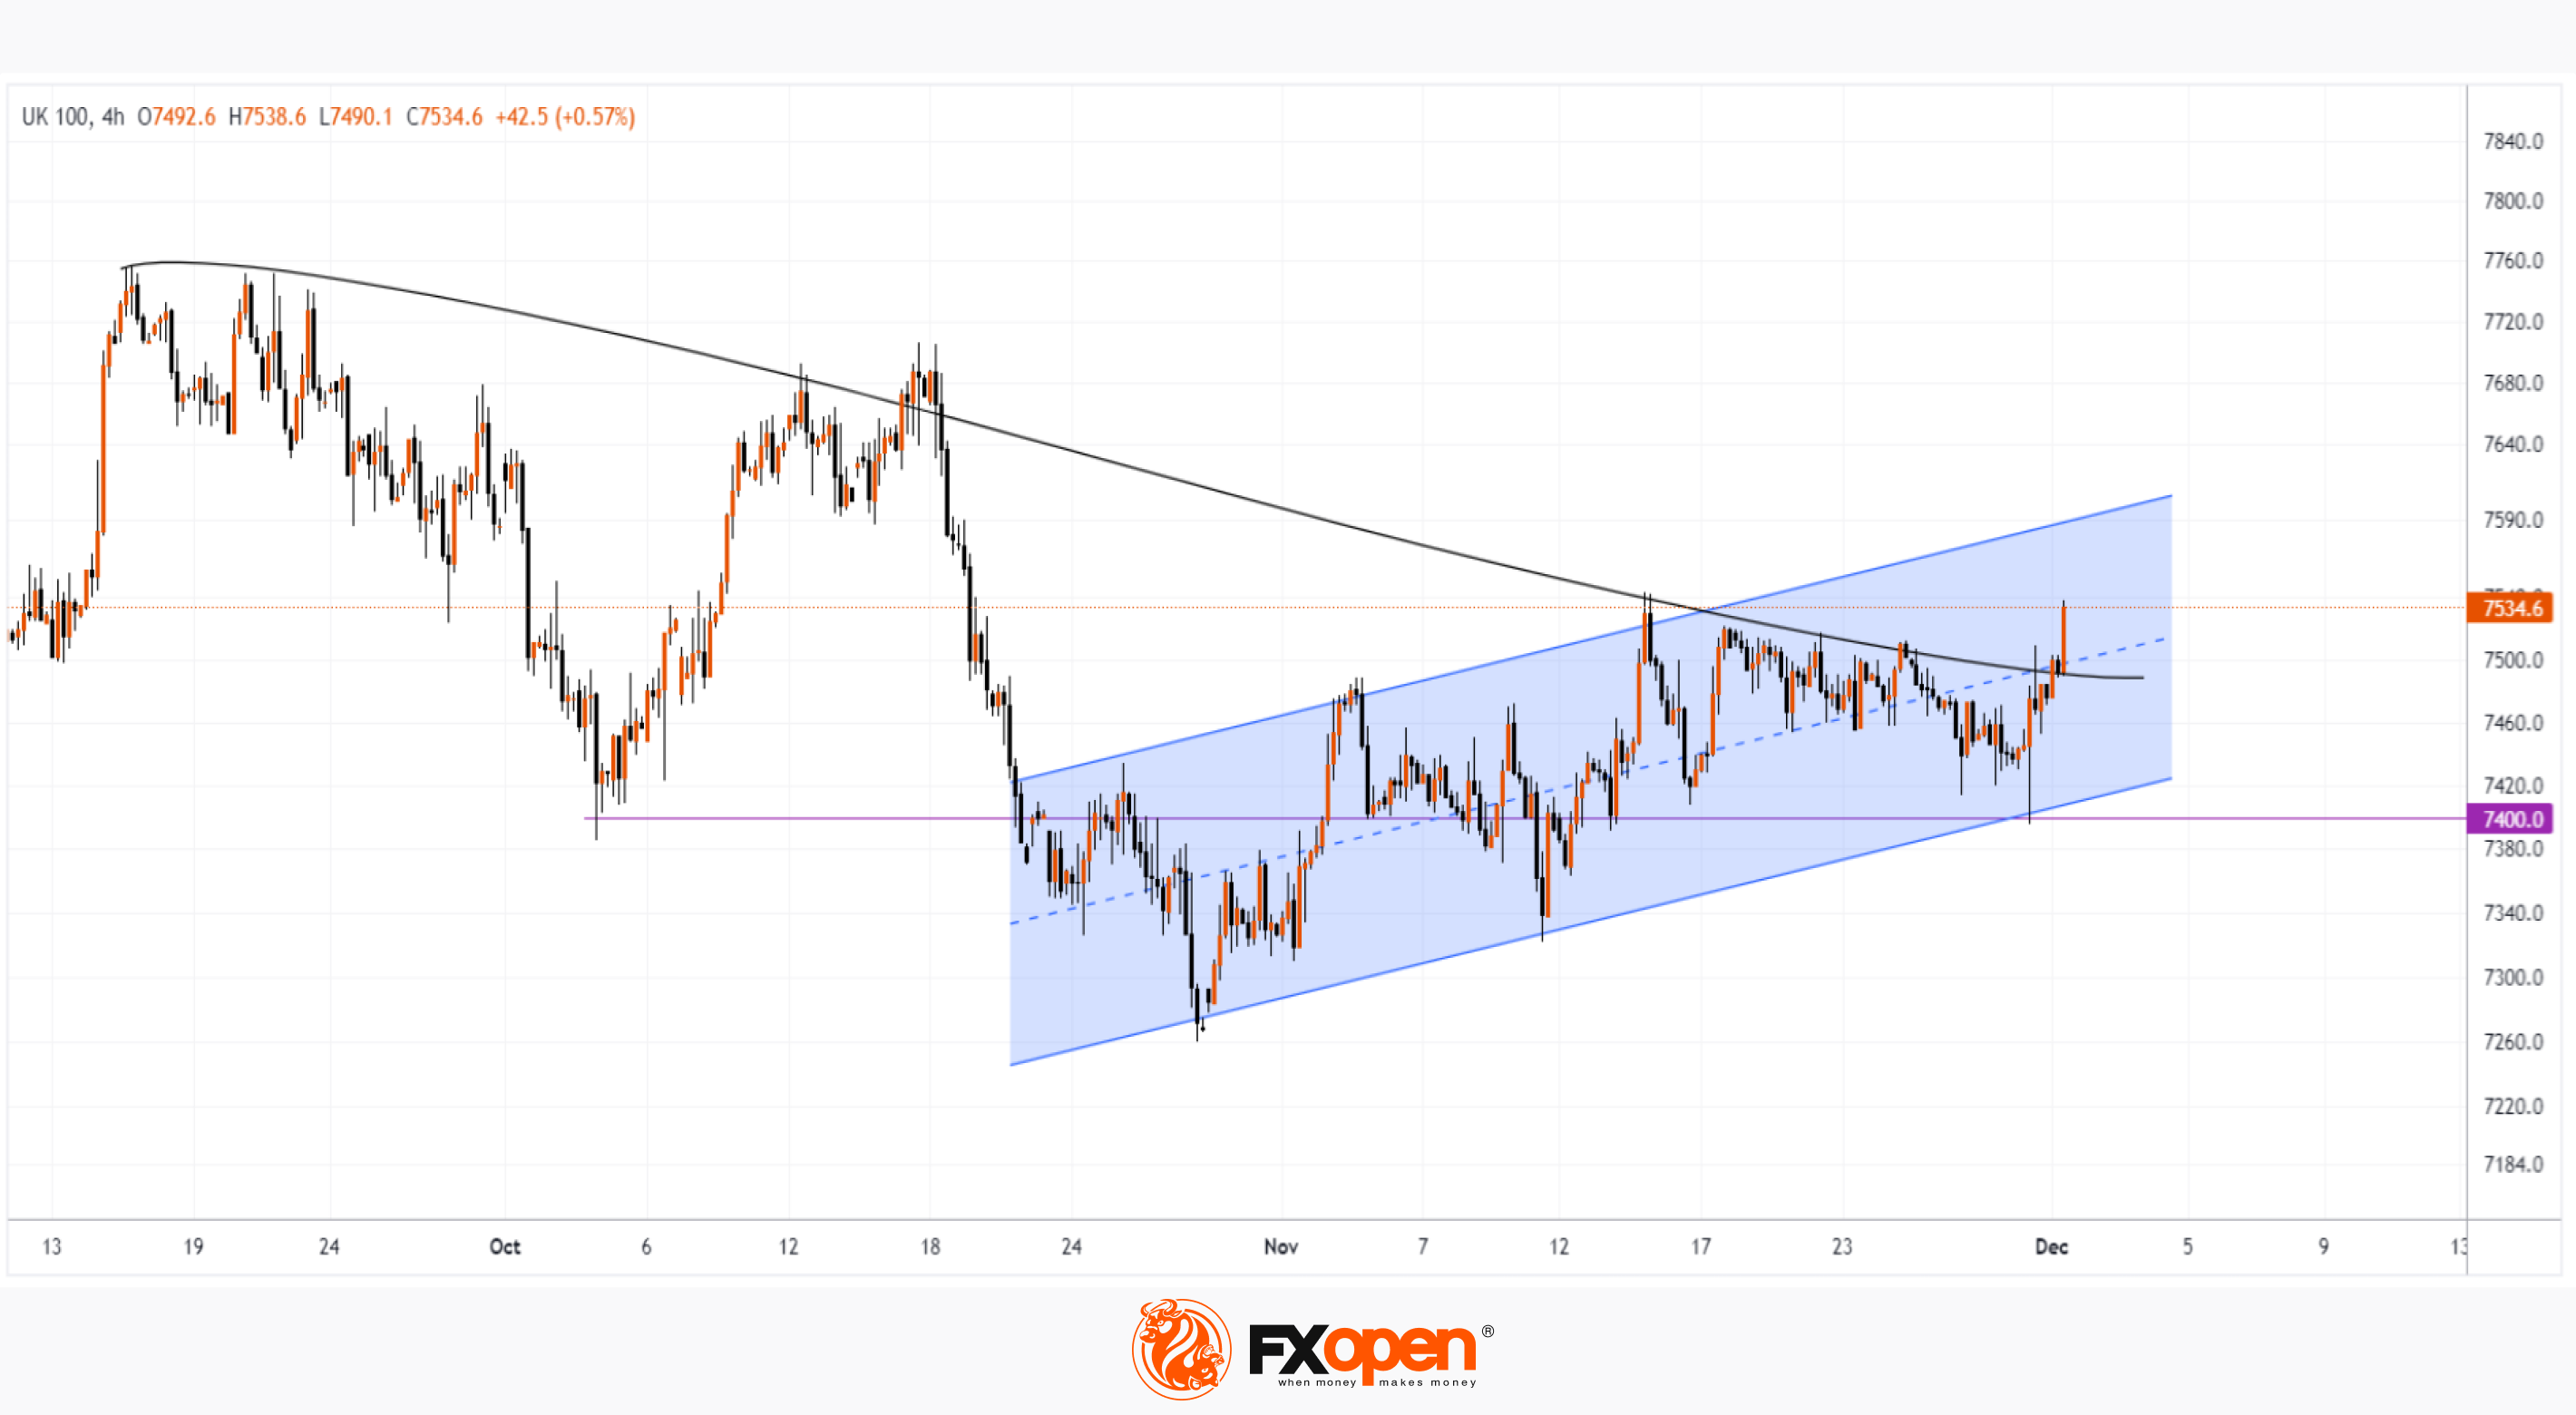
The UK100 Index chart shows signs of bullish activity:
→ on the last day of November, the price tested the psychological level of 7400, forming a long lower shadow (a sign of demand strength);
→ the price continues to develop dynamics within the November ascending channel (shown in blue). It is possible that in December we will see the price rise to its upper limit.
→ a breakdown of the black line, dating back to September, may confirm important changes in market sentiment.
Trade global index CFDs with zero commission and tight spreads (additional fees may apply). Open your FXOpen account now or learn more about trading index CFDs with FXOpen.
This article represents the opinion of the Companies operating under the FXOpen brand only. It is not to be construed as an offer, solicitation, or recommendation with respect to products and services provided by the Companies operating under the FXOpen brand, nor is it to be considered financial advice.
Stay ahead of the market!
Subscribe now to our mailing list and receive the latest market news and insights delivered directly to your inbox.


Latest articles

Weekly Market Insights with Gary Thomson: The Week of Central Banks and Earnings
In this video, we’ll explore the key economic events and market trends, shaping the financial landscape. Get ready for insights into financial markets to help you navigate the week ahead. Let’s dive in!
In this episode of Market

Intel at a Crossroads: Earnings Beat Meets Technical Resistance
Intel has just delivered its strongest quarter in over fifteen years, and the market reaction says it all. Q2 2026 revenue surged 25% year-over-year to $16.1 billion, crushing the consensus estimate of $14.42 billion, while adjusted EPS of

Tesla: Complex Range Structure Breaks Down Following Quarterly Earnings
Tesla released its Q2 2026 results after the market closed on 22 July. Revenue increased 26% year-on-year to $28.24 billion, while vehicle deliveries reached a record 480,126 units. However, operating margin fell sharply to 1.4%, down from