


Market Analysis: US30 Dow Jones Index Rises for 9 Sessions in a Row
FXOpen

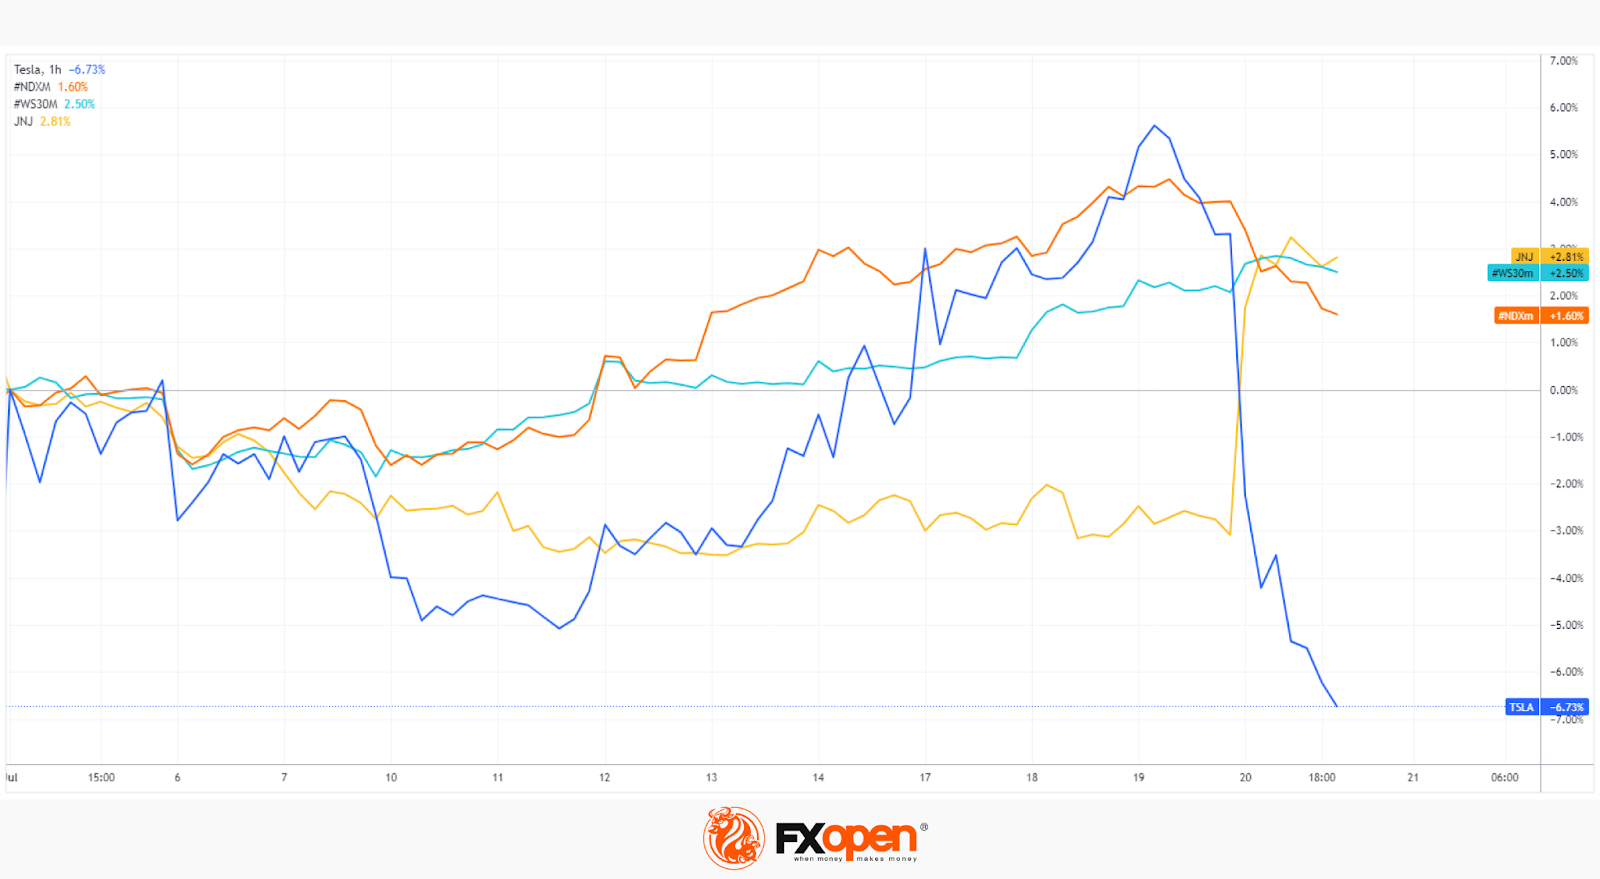
This is the most successful series in almost 6 years. Shares of JNJ helped demonstrate it to the US30 index, which rose by 6% after a strong report — J&J's profit and revenue turned out to be higher than expected. Sales worldwide grew by 6.3% in annual terms.
Unusually for 2023, the Dow Jones US30 is now acting stronger than the Nasdaq 100 technology stock index.
E-mini Nasdaq 100 futures are down almost 3% from a week high, driven by weak Netflix reports (reported yesterday) and a sharp drop in TSLA stock price (-9.7% per session) after a disappointing report. Investors are worried about Tesla's lower margins due to lower model prices, as well as a projected third-quarter production slowdown due to factory upgrades. At the same time, Musk remains optimistic and calls for looking at the bigger picture; in his opinion, the key to future profits will be fully autonomous driving.
The weakening of the Nasdaq 100 amid the bullish behavior of the Dow Jones US30 index suggests that a correction has begun in technology stocks, which is overdue due to the AI-related boom. How true this assumption is, it will be more clear after the reports of Microsoft (July 25), Apple (August 3), Google (July 25).
Trade global index CFDs with zero commission and tight spreads (additional fees may apply). Open your FXOpen account now or learn more about trading index CFDs with FXOpen.
This article represents the opinion of the Companies operating under the FXOpen brand only. It is not to be construed as an offer, solicitation, or recommendation with respect to products and services provided by the Companies operating under the FXOpen brand, nor is it to be considered financial advice.
Stay ahead of the market!
Subscribe now to our mailing list and receive the latest market news and insights delivered directly to your inbox.


Latest articles

Weekly Market Insights with Gary Thomson: The Week of Central Banks and Earnings Reports
In this video, we’ll explore the key economic events and market trends, shaping the financial landscape. Get ready for insights into financial markets to help you navigate the week ahead. Let’s dive in!
In this episode of Market
Bitcoin: Futures Momentum vs Spot Market Reality
Rising oil prices amid risks to shipping through the Strait of Hormuz have strengthened global inflation expectations. According to the Pentagon, clearing the strait could take at least six months, sustaining uncertainty in commodity markets and weighing on risk assets

EUR/USD and EUR/CAD Continue Correction Ahead of Key Data
The euro remains under pressure, extending its corrective decline following the previous impulsive rally. Market participants are taking profits and trimming positions ahead of key macroeconomic releases, reducing demand for the single currency and keeping both pairs near important levels,