


FXOpen

As the chart shows, the price of a barrel of US crude oil dropped below 72.10 per barrel yesterday for the first time since July 2023.
Fundamentally, this happened against the backdrop of:
→ Statistics showing that US oil exports are increasing. Volume is approaching a record 6 million barrels per day, with flows to Europe and Asia showing steady growth.
→ Previously announced measures to reduce oil production by OPEC+. However, either the price has already taken these statements into account in advance, or market participants are not confident that the reduction in OPEC+ supplies will be fully implemented — one way or another, so far the OPEC+ countries have not achieved the desired increase in oil prices. Perhaps, in order to discuss the oil market, Russian President Putin is flying to the UAE and Saudi Arabia today. And Deputy Prime Minister Alexander Novak said OPEC+ is ready to deepen oil production cuts in the first quarter of 2024 to eliminate “speculation and volatility” if existing production reduction measures are not enough.
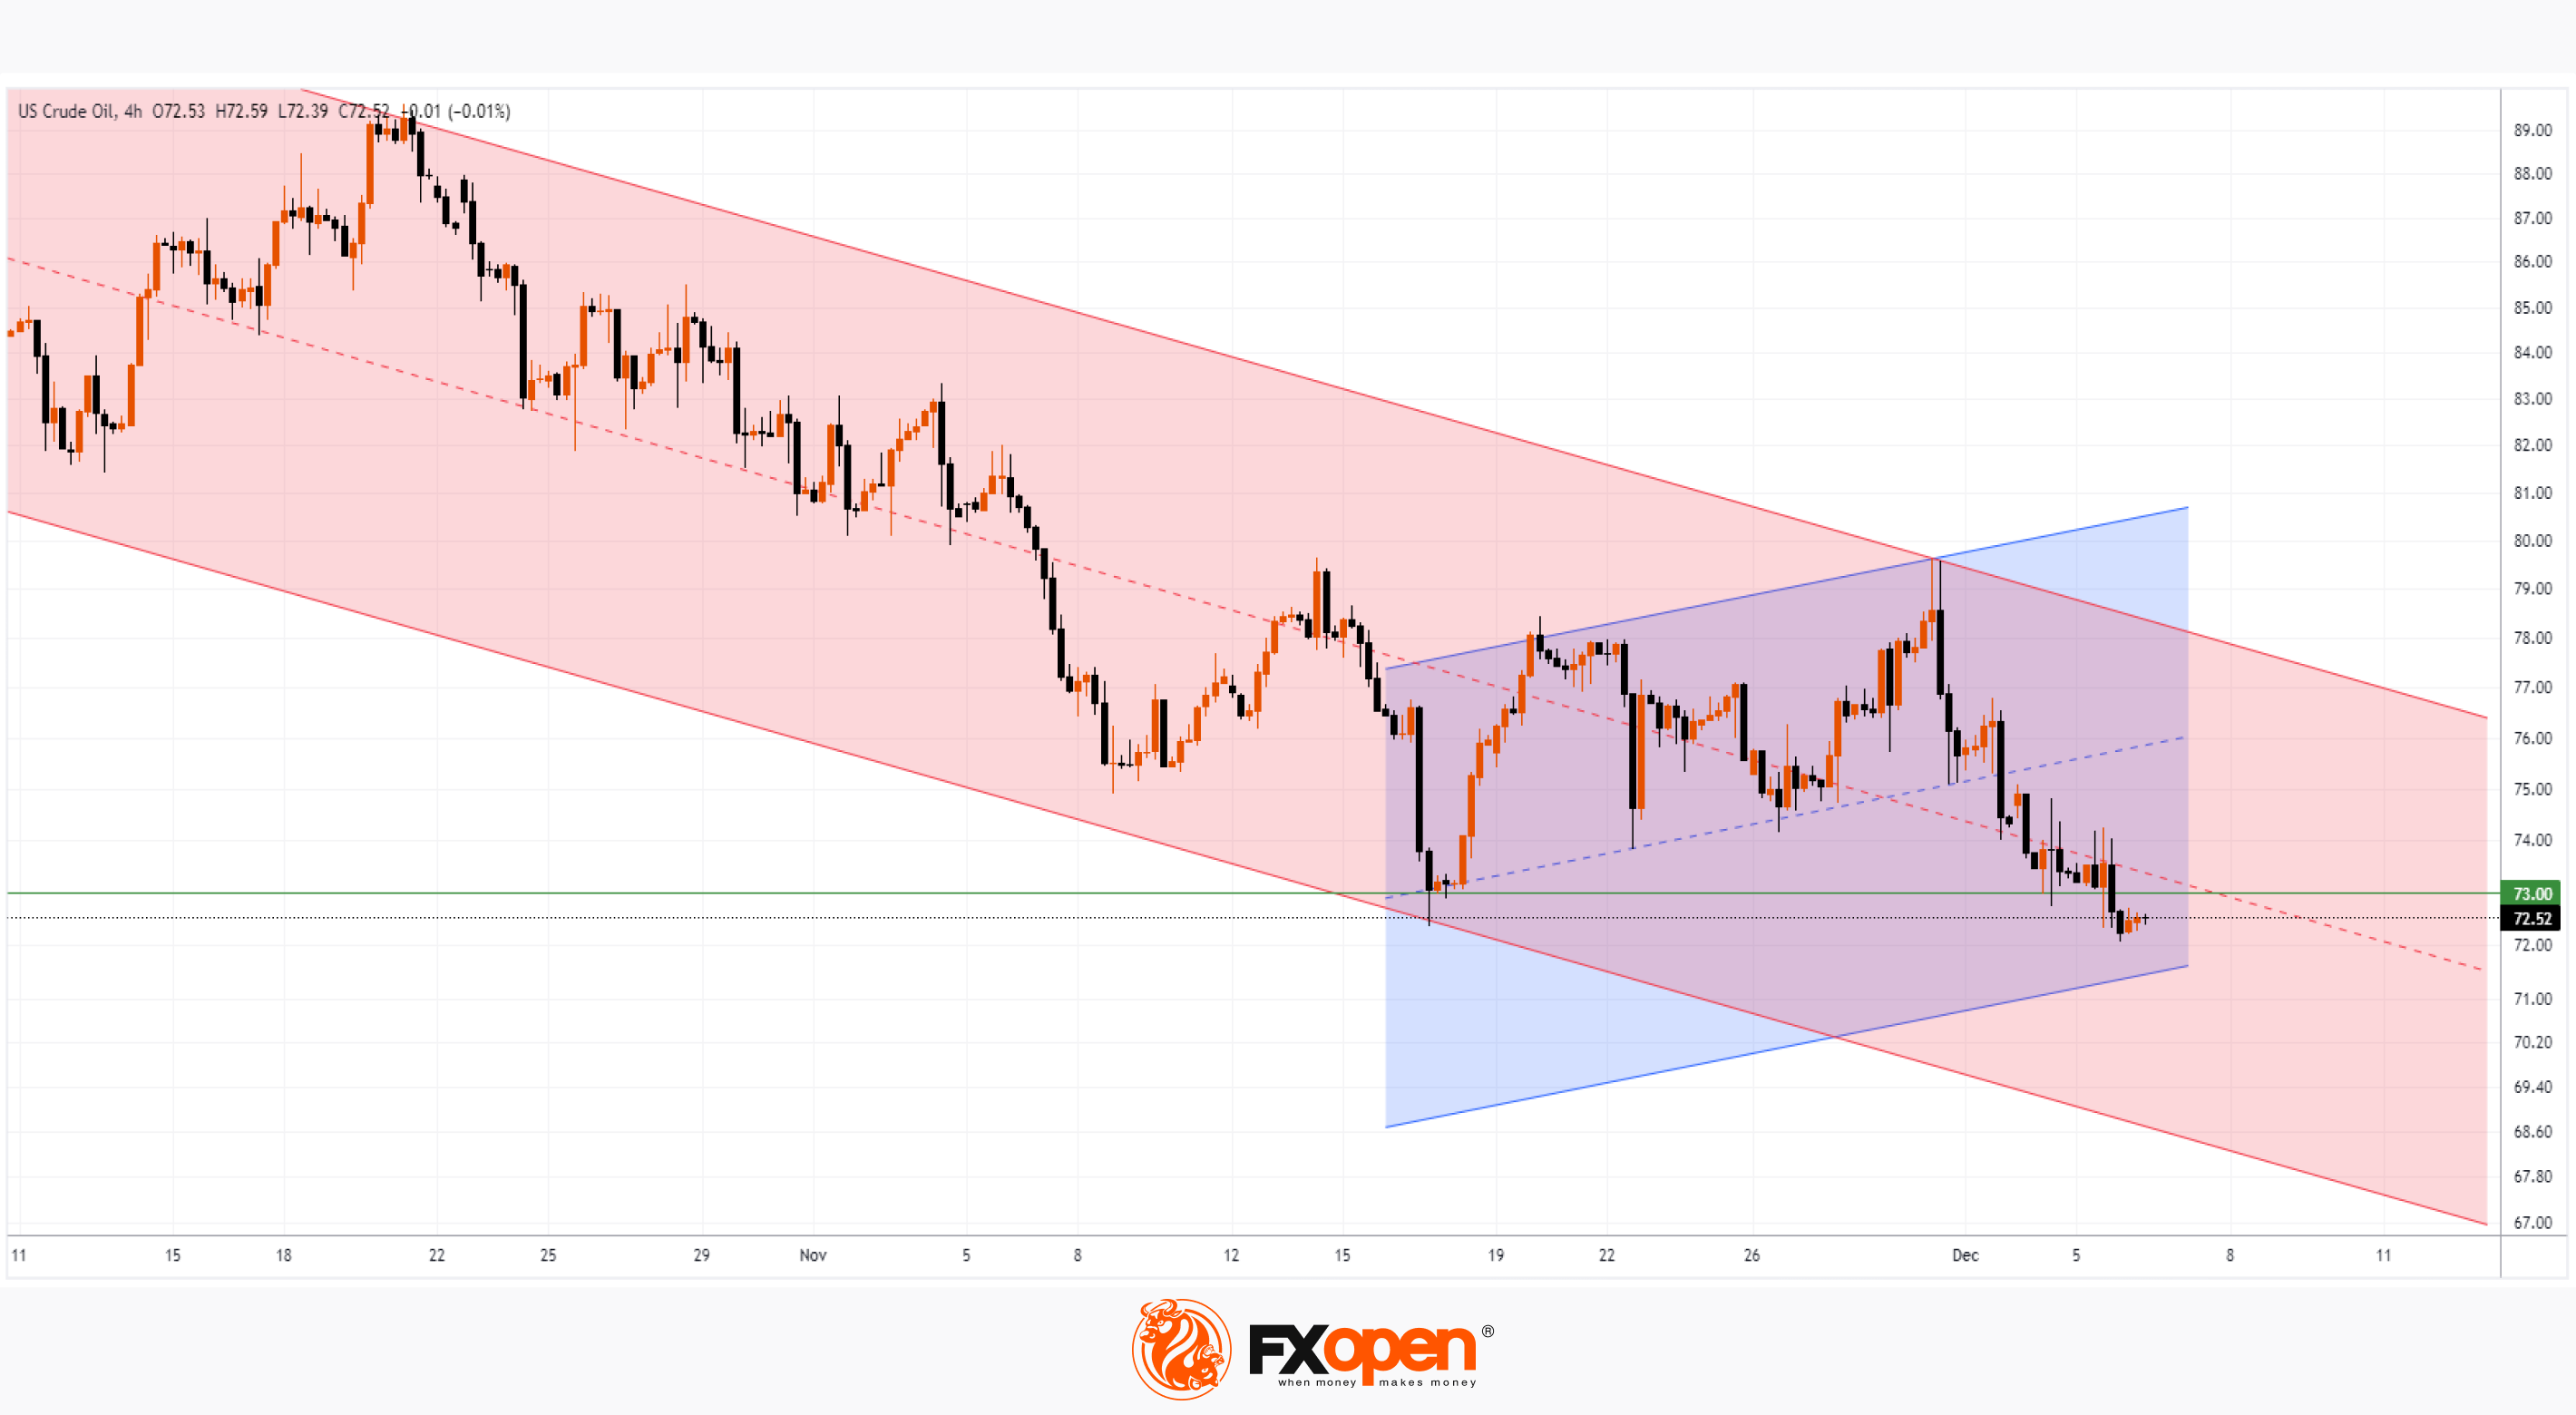
From a technical analysis point of view:
→ the price of oil continues to develop its dynamics within the descending channel (shown in red);
→ the rising channel (shown in blue) looks like an intermediate correction within a larger decline. The lower boundary of the parallel channel may provide support for the current decline;
→ yesterday's update to the low was very small, it looks like a false breakout of the November low. The bears seem unsure, but they may make a new attempt if there is a successful test of the level of $73 per barrel, which worked as support in early December, but today may provide resistance. Also pay attention to the lower boundary of the downward channel, where sellers can take profits from short positions.
Start trading commodity CFDs with tight spreads (additional fees may apply). Open your trading account now or learn more about trading commodity CFDs with FXOpen.
This article represents the opinion of the Companies operating under the FXOpen brand only. It is not to be construed as an offer, solicitation, or recommendation with respect to products and services provided by the Companies operating under the FXOpen brand, nor is it to be considered financial advice.
Stay ahead of the market!
Subscribe now to our mailing list and receive the latest market news and insights delivered directly to your inbox.


Latest articles

Consolidation Ahead of NFP: Commodity Currencies Search for Direction
Commodity-linked currencies have entered a consolidation phase following recent directional moves, as market participants adopt a wait-and-see approach ahead of key US labour market data. Current price action reflects a balance between ongoing demand for the US dollar and attempts

The Real Driver Behind the Dollar Rally: Market Insights with Gary Thomson
The US dollar has been firm, but the drivers behind the move may be more complex than they first appear.
While geopolitical tension and shifts in risk sentiment play a role, current price behaviour seems increasingly influenced by inflation expectations

EUR/USD and USD/CHF Pull Back: Market Reacts to Fundamentals
European currencies have shown a recovery in recent trading sessions after their recent decline, displaying early signs of a reversal. The US dollar is weakening amid expectations surrounding upcoming US macroeconomic data, while market participants are reassessing their short-term positions