


Market Analysis: Yield Curve and Stock Market Downside Risks
FXOpen

The yield curve compares three-month, two-year, five-year, 10-year and 30-year US Treasury bonds. Under a normal curve, the longer the maturity, the higher the yield.
However, analysts at Crescat Capital point to an inversion in the current bond market — yields on short-term bonds are clearly higher. This can be used as a harbinger of a sharp decline in the price of stock indices, as history shows: the inversion was observed before the crisis of 2008, during the dot-com bubble in 2000, and even during the sharp decline in the price of the S&P 500 during the pandemic in 2020.
At the same time, the danger may lie primarily for the technology stocks included in the Nasdaq 100, because this market feels the hype due to AI. So, during yesterday's trading, futures for technology stocks E-mini Nasdaq 100 fell much faster than the E-mini S&P 500.
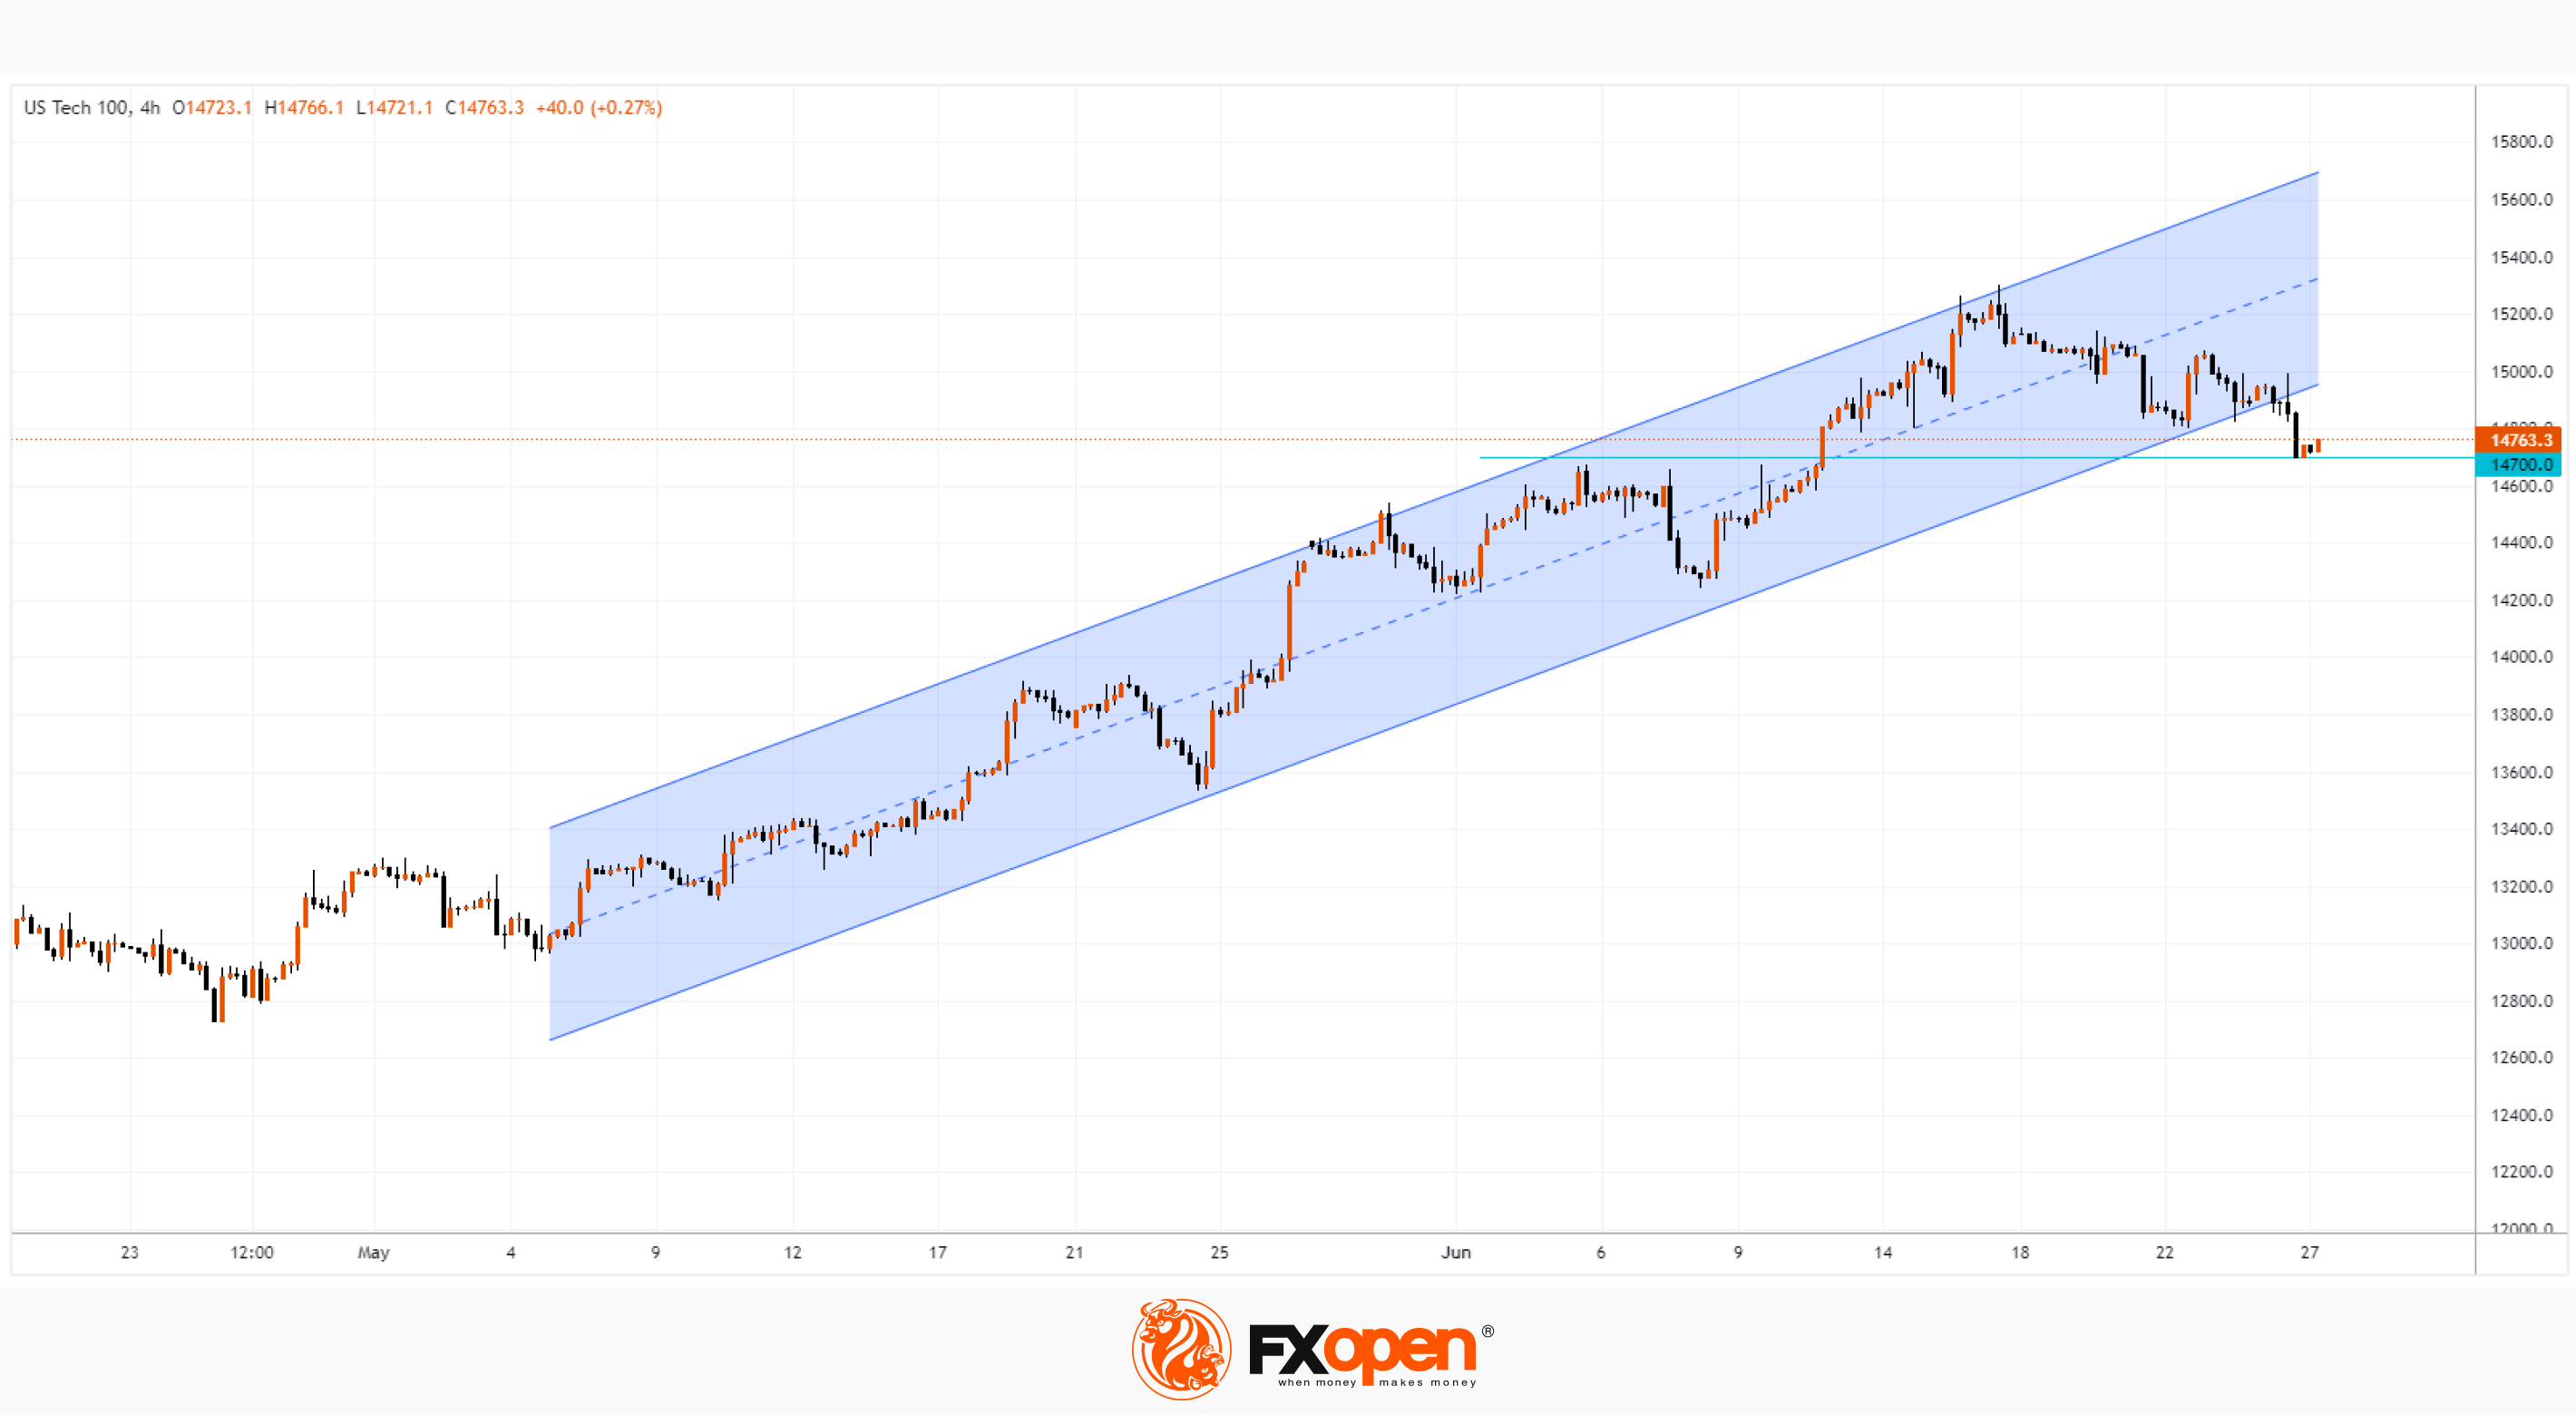
The Nasdaq 100 chart is also showing alarming signals. The price of the index broke down the channel (shown in blue) of the uptrend, which has been operating on the market since May. So far, the bulls are feeling support from the 14,700 level, which served as resistance earlier this month. But the support could be short-lived and the market could become bearish, adding to the urgency of the yield curve warning.
Trade global index CFDs with zero commission and tight spreads (additional fees may apply). Open your FXOpen account now or learn more about trading index CFDs with FXOpen.
This article represents the opinion of the Companies operating under the FXOpen brand only. It is not to be construed as an offer, solicitation, or recommendation with respect to products and services provided by the Companies operating under the FXOpen brand, nor is it to be considered financial advice.
Stay ahead of the market!
Subscribe now to our mailing list and receive the latest market news and insights delivered directly to your inbox.


Latest articles

EUR/USD Eyes Gains As USD/CHF Weakness Deepens Again
EUR/USD started a fresh increase above 1.1700 and 1.1720. USD/CHF declined further and is now struggling below 0.7835.
Important Takeaways for EUR/USD and USD/CHF Analysis Today
· The Euro started a decent increase from

Apple: Earnings Day Above the Activity Zone
On 30 April, after the market close, Apple Inc. will release its financial results for the second quarter of fiscal 2026. The consensus forecast, based on estimates from 31 analysts, points to revenue of around $109.7 billion, with expected

USD/JPY and USD/CHF Near Key Levels: The Dollar Supported by the Fed
The US dollar continues to trend upwards following the Federal Reserve meeting, drawing support from the regulator’s moderately hawkish stance and comments by Jerome Powell. Markets interpret the Fed’s rhetoric as a signal that restrictive policy is likely