


FXOpen

On 19 November, we analysed the Meta Platforms (META) stock chart, highlighting:
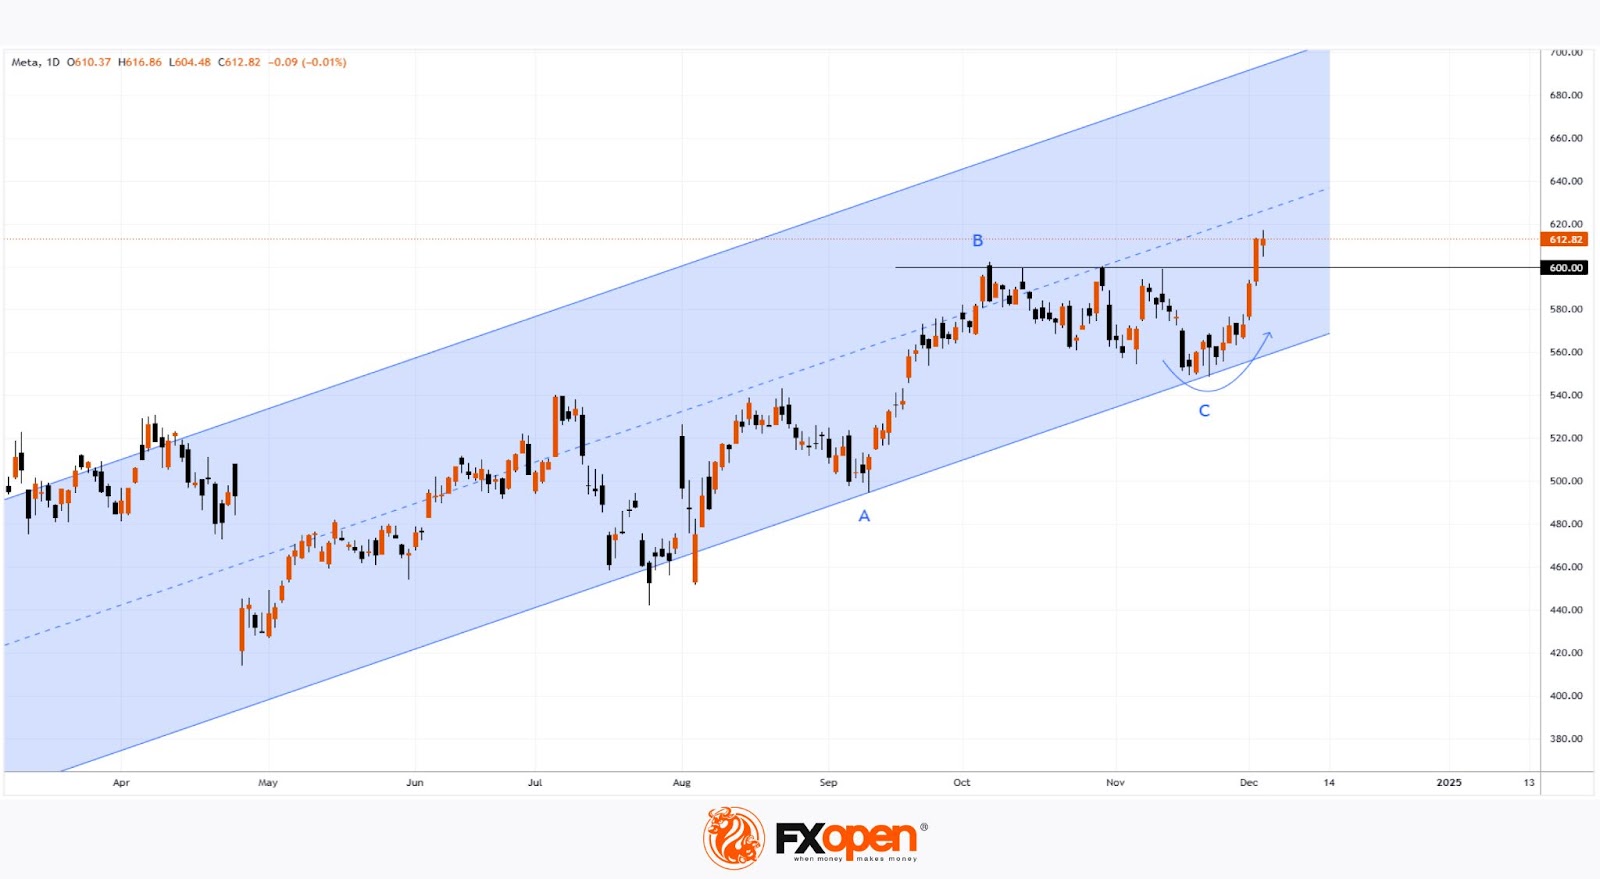
→ the formation of a long-term upward channel (shown in blue);
→ the importance of the psychological $600 level;
→ the scenario of a bullish trend resumption with a rebound from the channel's lower boundary.
Since then:
→ as anticipated, the price reversed upwards (indicated by an arrow);
→ it broke key resistance at $600, reaching an all-time high.
The bullish momentum in META's stock price was supported by reports that:
→ AI-based tools are helping the company better monetise its vast user base and boost advertising revenue;
→ CEO Mark Zuckerberg dined with Donald Trump, suggesting their relationship may improve after Trump's prior criticism of Zuckerberg's platforms over information policies.
What’s Next?
Technical analysis of Meta Platforms (META) stock shows:
→ the decline from B to C represents approximately 50% of the rise from A to B – a bullish signal;
→ after two strong candles on Monday and Tuesday, price growth slowed on Wednesday – a bearish signal.
This suggests that buying momentum may be weakening, and bulls might now focus on maintaining levels above $600.
Analysts remain optimistic. According to TipRanks:
→ 40 out of 44 surveyed analysts recommend buying META stock;
→ the average 12-month price target for META is $662.
Buy and sell stocks of the world's biggest publicly-listed companies with CFDs on FXOpen’s trading platform. Open your FXOpen account now or learn more about trading share CFDs with FXOpen.
This article represents the opinion of the Companies operating under the FXOpen brand only. It is not to be construed as an offer, solicitation, or recommendation with respect to products and services provided by the Companies operating under the FXOpen brand, nor is it to be considered financial advice.
Stay ahead of the market!
Subscribe now to our mailing list and receive the latest market news and insights delivered directly to your inbox.


Latest articles

Gold Price Holds Near Key Support
As the XAU/USD chart shows, the gold price has been holding within the $5,060–$5,200 range over the past several sessions.
Bullish view: the key support is the lower boundary of the long-term channel that has been

EUR/USD Chart Analysis: Pair Rebounds from the Year’s Low
Analysing the EUR/USD chart five days ago, we:
→ constructed a downward channel, noting signs that the bears remained in control;
→ outlined a scenario in which the rate would decline to a new yearly low (and test the lower boundary

Dollar Index (DXY) Hits Yearly High
Today, the dollar index rose above last week’s peak around the 99.68 level, setting a new high for 2026. This movement is supported by a tense fundamental backdrop:
→ Inflationary pressures from rising oil prices. Markets may be pricing