


Meta Platforms (META) Stock Price Nears $600 Milestone
FXOpen

As reported by Barron’s, October has historically been the second-best month for the information technology sector in the S&P 500. The sector typically gains an average of 2.7% in October, according to Dow Jones Market Data. The best month is November, with an average increase of 3.1%. This trend likely follows the statistically weakest month—September. Meta Platforms (META)’s strong performance supports these historical patterns.
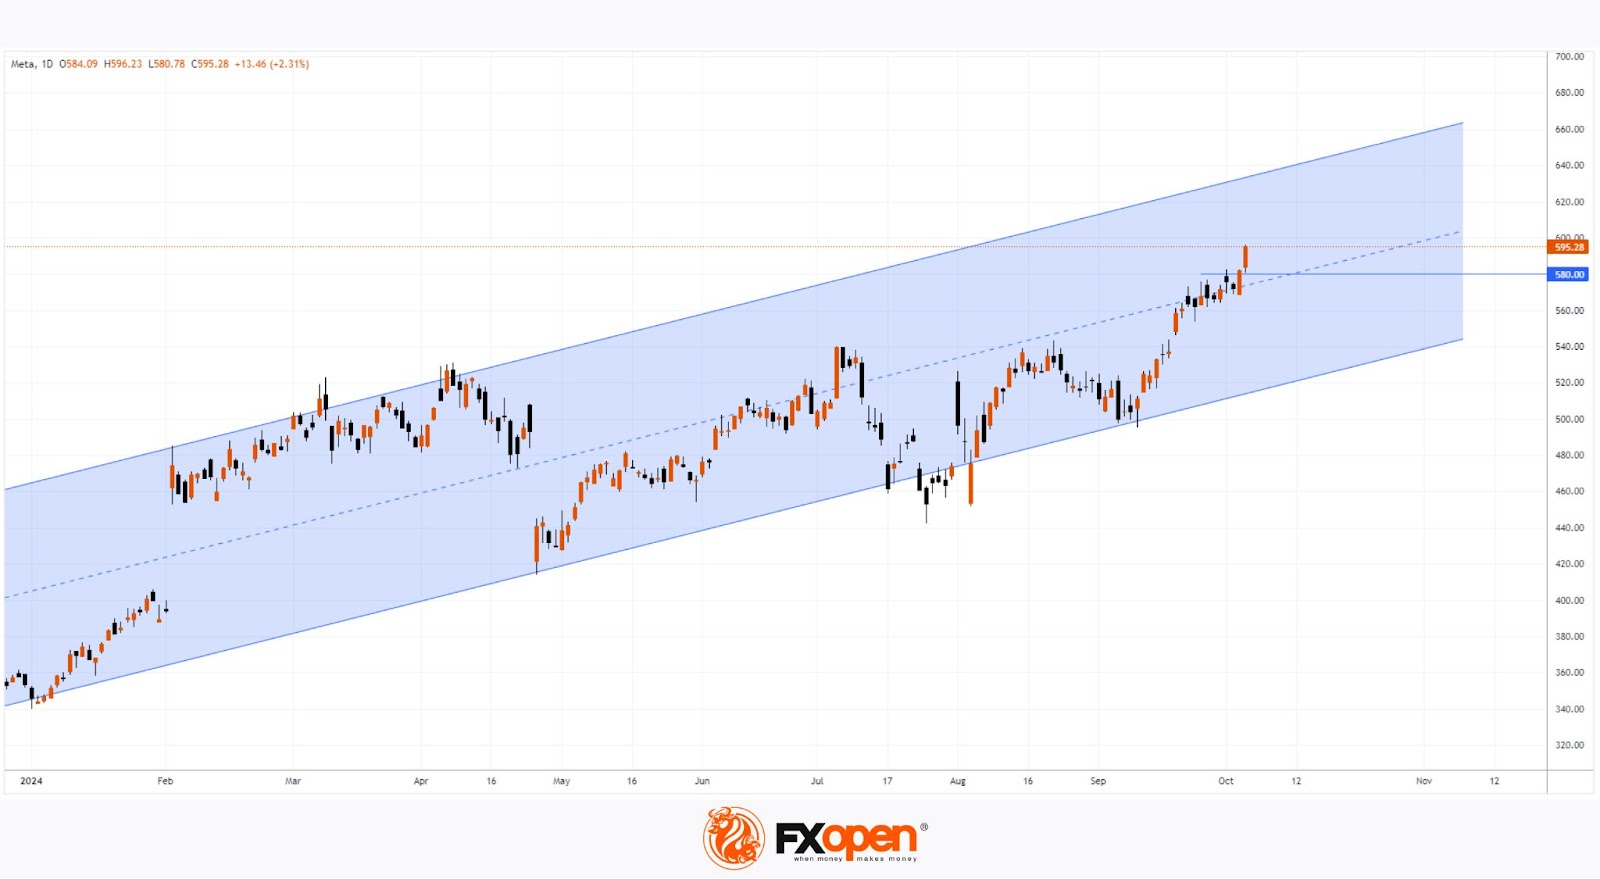
In our analysis of Meta Platforms’ stock chart on 25th September, we noted that the price was forming an ascending channel (shown in blue). Before breaking a key resistance level at $540, the price formed a bullish “inverted cup and handle” pattern, which coincided with another bullish pattern—the “inverted head and shoulders.”
Since then, Meta Platforms’ stock has maintained its upward trend, reaching new all-time highs. The price has surpassed $595 and is now nearing the psychological $600 mark.
Several factors have contributed to the bullish sentiment:
→ The upcoming earnings season. Meta Platforms is set to release its Q3 results on 30th September.
→ Excitement surrounding new developments at Meta Platforms Inc., including the augmented reality device Orion and the AI-powered tool Movie Gen, which generates videos based on text prompts.
→ A strong stock market rally, driven by better-than-expected September jobs data. Non-farm payrolls increased by 254,000 last month, surpassing the consensus estimate of 150,000 from a Bloomberg survey. The unemployment rate fell to 4.1% from 4.2% in August, contrary to analysts' expectations of no change.
Technical Analysis of Meta Platforms (META) Stock
The stock continues to move within the blue ascending channel. The relatively low volatility seen since 20th September could be attributed to the price's proximity to the channel’s median, which often balances supply and demand. However, Friday’s large bullish candlestick, opening near the low and closing near the high, signals renewed buying momentum. This suggests that the $580 level may serve as future support, as the chart indicates a buyer's advantage here.
According to a TipRanks analyst survey, the average price target for META over the next 12 months is $608.
Buy and sell stocks of the world's biggest publicly-listed companies with CFDs on FXOpen’s trading platform. Open your FXOpen account now or learn more about trading share CFDs with FXOpen.
This article represents the opinion of the Companies operating under the FXOpen brand only. It is not to be construed as an offer, solicitation, or recommendation with respect to products and services provided by the Companies operating under the FXOpen brand, nor is it to be considered financial advice.
Stay ahead of the market!
Subscribe now to our mailing list and receive the latest market news and insights delivered directly to your inbox.


Latest articles

AUD/CAD: Months of Indecision — Is a Breakout Finally Coming?
The Australian dollar has clawed back most of its end-of-June losses, when it touched three-month lows against the greenback amid escalating Middle East tensions. Since then, sentiment has improved: the RBA's Assistant Governor Sarah Hunter signalled the board stands ready

USD/JPY: Battling at the Top of the Triangle
On 3 July, Japan's Finance Minister, Satsuki Katayama, stated that the Ministry of Finance remains in close contact with US authorities regarding developments in USD/JPY as the yen traded near its weakest level in almost 40 years. Similar verbal

Dow Jones (DJIA): Consolidation Beyond the Trend
Federal Reserve Chair Kevin Warsh testified before Congress on 14–15 July, reaffirming the Fed's commitment to bringing inflation back to target while providing no clear guidance on the future path of interest rates. Meanwhile, June inflation data came in