


Microsoft (MSFT) Shares Decline Despite Strong Earnings Report
FXOpen

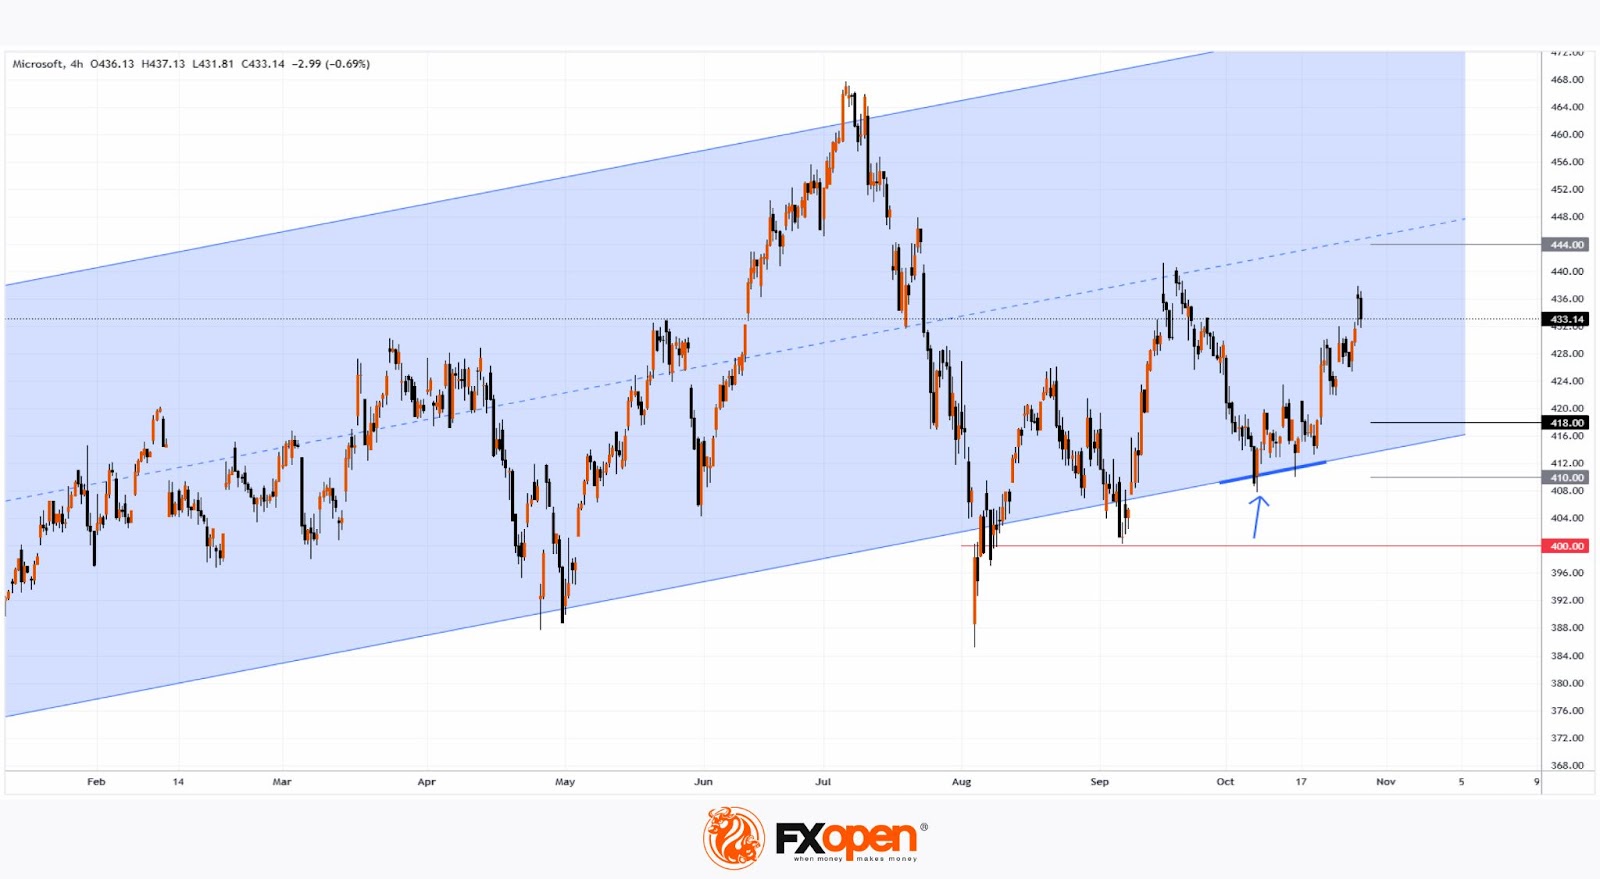
On 9 October, our analysis of Microsoft (MSFT) suggested that the stock price:
→ Was forming an ascending channel (shown in blue on the chart);
→ Could see a rebound from its lower boundary (indicated by an arrow).
Since then, the price indeed moved upward from this support around the $411 level, even surpassing $437. However, following Microsoft’s Q3 earnings report released post-market yesterday, the share price faced heightened volatility.
In the Q3 report:
→ Earnings per share (EPS) came in at $3.30, exceeding the expected $3.10;
→ Gross revenue was $65.58 billion, also above the forecasted $64.57 billion.
Despite these positive figures, MSFT shares saw a decline due to high volatility during after-hours trading, reaching $444 at one point and then falling to around $410. This drop may be due to Microsoft’s rising expenses. As reported by The Wall Street Journal, Microsoft’s capital expenditures in 2024 have hit $53 billion (about 28% of revenue), a substantial increase from the 12% average of revenue allocated to capital costs between 2014 and 2023.
As of pre-market trading today, MSFT is trading around $417 (approximately -4% from yesterday’s close), likely setting the opening level for today’s main session.
Today’s technical analysis of MSFT suggests that the opening may see a bearish gap, potentially pushing MSFT’s price toward the lower boundary of the ascending blue channel, where a new consensus between buyers and sellers could emerge. This sets up two scenarios:
→ Bulls may see an opportunity for another rebound;
→ Bears could aim for a breakdown of this key support level, with potential testing of the psychological $400 level.
Analyst sentiment remains positive. According to TipRanks surveys:
→ 27 out of 30 analysts recommend buying MSFT shares;
→ The average 12-month target price for MSFT is $503.
Buy and sell stocks of the world's biggest publicly-listed companies with CFDs on FXOpen’s trading platform. Open your FXOpen account now or learn more about trading share CFDs with FXOpen.
This article represents the opinion of the Companies operating under the FXOpen brand only. It is not to be construed as an offer, solicitation, or recommendation with respect to products and services provided by the Companies operating under the FXOpen brand, nor is it to be considered financial advice.
Stay ahead of the market!
Subscribe now to our mailing list and receive the latest market news and insights delivered directly to your inbox.


Latest articles

AUD/CAD: Months of Indecision — Is a Breakout Finally Coming?
The Australian dollar has clawed back most of its end-of-June losses, when it touched three-month lows against the greenback amid escalating Middle East tensions. Since then, sentiment has improved: the RBA's Assistant Governor Sarah Hunter signalled the board stands ready

USD/JPY: Battling at the Top of the Triangle
On 3 July, Japan's Finance Minister, Satsuki Katayama, stated that the Ministry of Finance remains in close contact with US authorities regarding developments in USD/JPY as the yen traded near its weakest level in almost 40 years. Similar verbal

Dow Jones (DJIA): Consolidation Beyond the Trend
Federal Reserve Chair Kevin Warsh testified before Congress on 14–15 July, reaffirming the Fed's commitment to bringing inflation back to target while providing no clear guidance on the future path of interest rates. Meanwhile, June inflation data came in