


Microsoft (MSFT) Shares Fall Below $460
FXOpen

As the Microsoft (MSFT) share chart shows:
→ yesterday’s candle closed below $460 — the lowest level since early June last year;
→ the decline from the all-time high near $550 has exceeded 16%.
Why MSFT Shares Are Falling
The downward move may reflect a shift in market sentiment from AI-driven euphoria to a more sober reassessment of the actual returns on investment. Investors are locking in profits amid concerns that the company’s current infrastructure spending may not pay off in the near term.
Concerns have been reinforced by media reports of:
→ disappointing sales momentum for its AI products (Microsoft 365 Copilot);
→ intensifying competition, including from Google Gemini and Amazon AWS;
→ rising capital expenditure (forecast at more than $80bn per year).
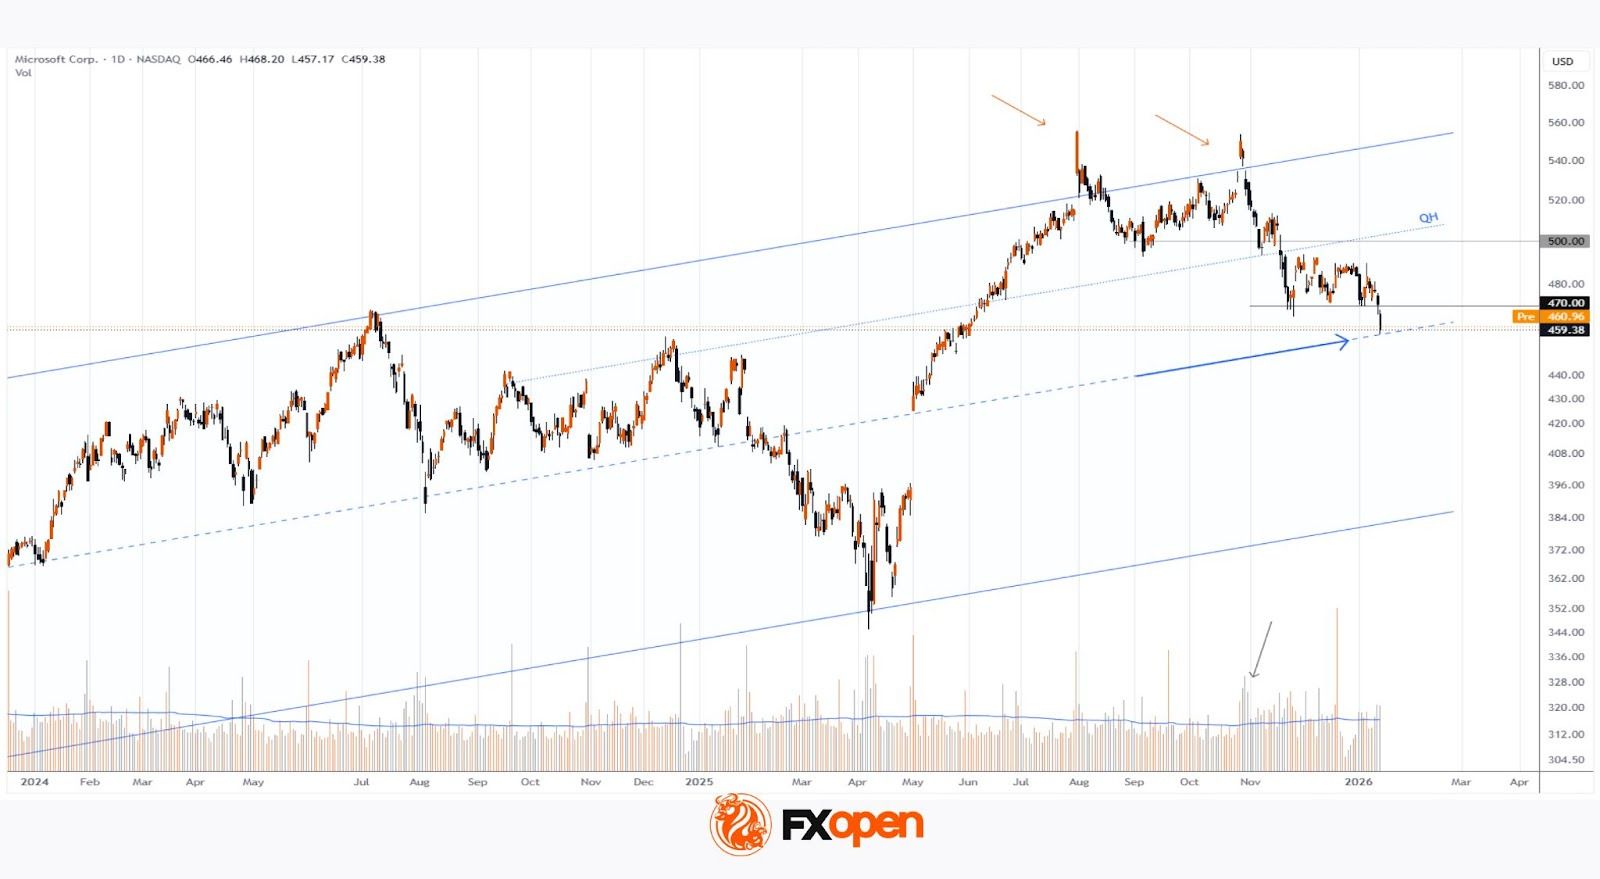
Technical Analysis of Microsoft (MSFT) Shares
From a long-term perspective, the share price continues to move within a key ascending channel. In this context:
→ the lower boundary acted as support in April 2025;
→ the upper boundary has served as resistance. The orange arrows highlight aggressive selling pressure whenever the price moves beyond it. The black arrow points to rising volumes during the price decline in early November — a bearish signal following overbought conditions;
→ the QH line, which divides the upper half of the channel into two parts, has switched from support to resistance near the psychological $500 level;
→ the current price has fallen towards the channel’s median, where supply and demand typically come into balance (marked by the blue arrow).
In light of the above, it is reasonable to assume that the market may find an equilibrium that could persist until 28 January, when the quarterly earnings report is scheduled for release.
Buy and sell stocks of the world's biggest publicly-listed companies with CFDs on FXOpen’s trading platform. Open your FXOpen account now or learn more about trading share CFDs with FXOpen.
This article represents the opinion of the Companies operating under the FXOpen brand only. It is not to be construed as an offer, solicitation, or recommendation with respect to products and services provided by the Companies operating under the FXOpen brand, nor is it to be considered financial advice.
Stay ahead of the market!
Subscribe now to our mailing list and receive the latest market news and insights delivered directly to your inbox.


Latest articles

Weekly Market Insights with Gary Thomson: The Week of Central Banks and Earnings
In this video, we’ll explore the key economic events and market trends, shaping the financial landscape. Get ready for insights into financial markets to help you navigate the week ahead. Let’s dive in!
In this episode of Market

Intel at a Crossroads: Earnings Beat Meets Technical Resistance
Intel has just delivered its strongest quarter in over fifteen years, and the market reaction says it all. Q2 2026 revenue surged 25% year-over-year to $16.1 billion, crushing the consensus estimate of $14.42 billion, while adjusted EPS of

Tesla: Complex Range Structure Breaks Down Following Quarterly Earnings
Tesla released its Q2 2026 results after the market closed on 22 July. Revenue increased 26% year-on-year to $28.24 billion, while vehicle deliveries reached a record 480,126 units. However, operating margin fell sharply to 1.4%, down from