


FXOpen

On Wednesday, after the close of the regular trading session, Microsoft (MSFT) released its quarterly earnings report, which exceeded analysts’ expectations:
→ Earnings per share: actual $4.14, forecast $3.90;
→ Gross revenue: actual $81.2bn, forecast $80.3bn;
→ Operating profit: up 21%.
Despite the strong results, MSFT shares suffered a dramatic sell-off of around 10% by the close of yesterday’s trading. According to media reports, this was the largest one-day drop in Microsoft’s share price on record, with the company losing roughly $360bn in market capitalisation.
Why MSFT Shares Collapsed
Market participants were most likely disappointed by the following factors:
→ A sharp rise in capital expenditure: capex surged by 66% to $37.5bn as Microsoft continued to invest heavily in data centres and AI infrastructure, while the timing of meaningful returns on these investments remains uncertain.
→ Slowing growth in the cloud computing segment.
Technical Analysis of Microsoft (MSFT) Shares
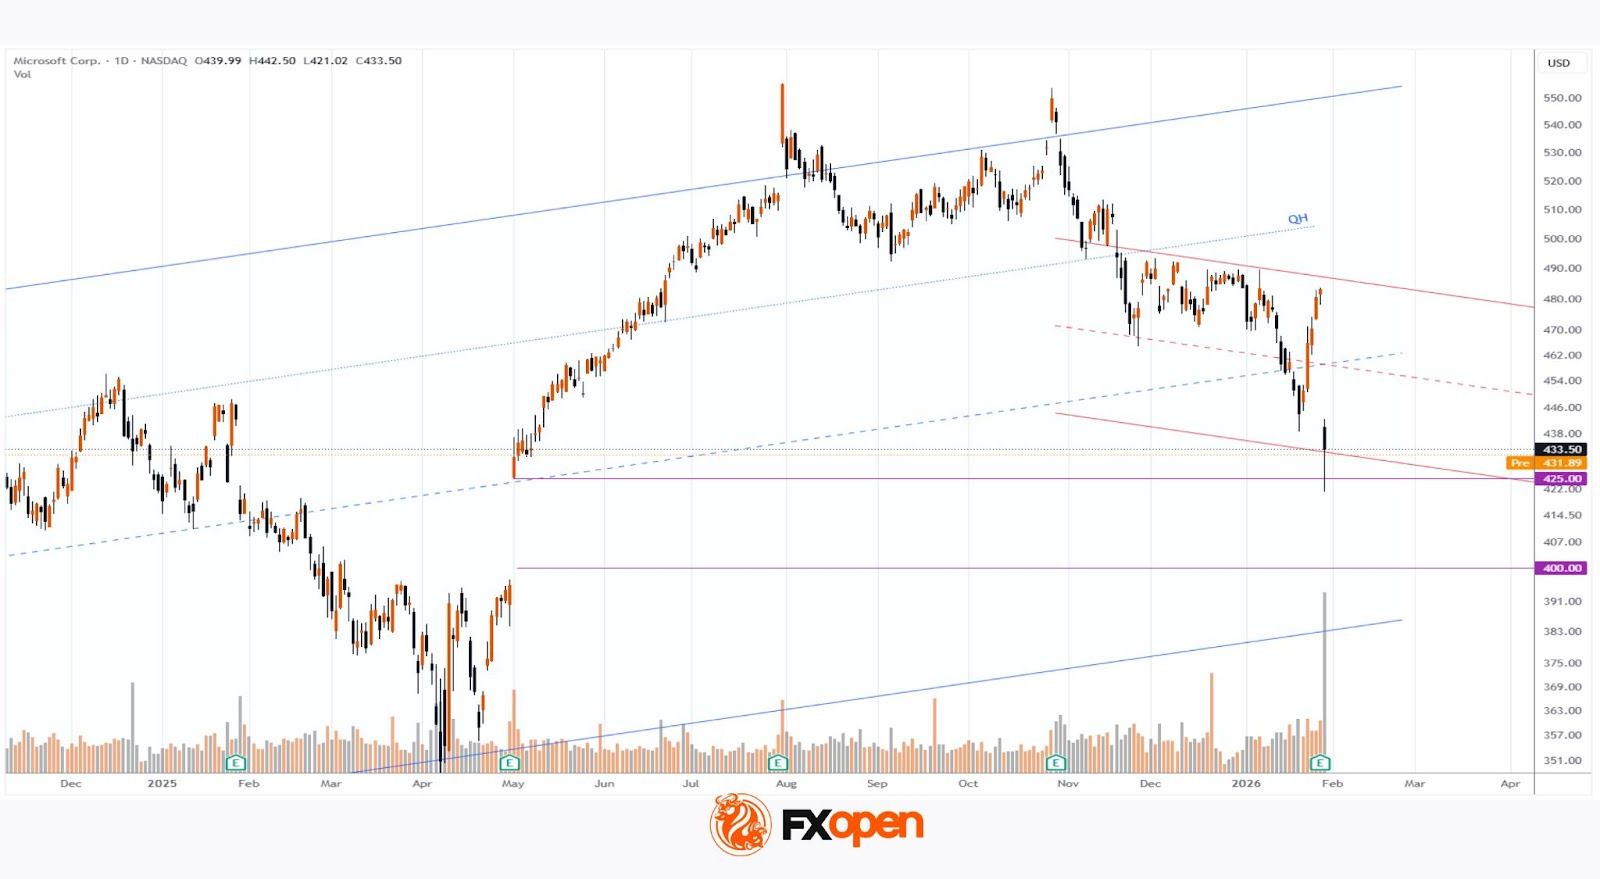
When analysing the MSFT chart on 15 January, we identified a key ascending channel reflecting the stock’s long-term price structure. At that time, we suggested that the market might find a temporary balance ahead of the earnings release.
Since then, although volatility persisted, the price showed an ability to recover from 22 January onwards, indicating that buyers were attempting to wrest control from sellers.
Yesterday’s record decline significantly altered the picture, but two factors are worth noting:
1 → The price fell below the 1 May low, entering the area of a broad bullish gap located above the psychological $400 level.
2 → In 2026, the market has been forming a descending channel (shown in red), with the price now reaching its lower boundary.
It is reasonable to assume that these two factors could act as support. The structure of yesterday’s candle supports this view: the session closed well above the low, and trading volumes were the highest in several years. This suggests active buying interest, with the price rebounding from around $422 to $433.
As a result, it is possible that the initial emotional reaction may fade and MSFT shares will avoid a further acceleration of the downtrend. However, a meaningful shift back to a bullish market structure would require strong fundamental catalysts.
Buy and sell stocks of the world's biggest publicly-listed companies with CFDs on FXOpen’s trading platform. Open your FXOpen account now or learn more about trading share CFDs with FXOpen.
This article represents the opinion of the Companies operating under the FXOpen brand only. It is not to be construed as an offer, solicitation, or recommendation with respect to products and services provided by the Companies operating under the FXOpen brand, nor is it to be considered financial advice.
Stay ahead of the market!
Subscribe now to our mailing list and receive the latest market news and insights delivered directly to your inbox.


Latest articles

Market Analysis: Gold Price Slips Back, WTI Crude Oil Rally Gains Fresh Strength
Gold price rallied above $4,750 before correcting lower. Crude oil prices are rising and could climb further higher toward $110.00.
Important Takeaways for Gold and WTI Crude Oil Prices Analysis Today
· Gold price gained pace for a move

Consolidation Ahead of NFP: Commodity Currencies Search for Direction
Commodity-linked currencies have entered a consolidation phase following recent directional moves, as market participants adopt a wait-and-see approach ahead of key US labour market data. Current price action reflects a balance between ongoing demand for the US dollar and attempts

The Real Driver Behind the Dollar Rally: Market Insights with Gary Thomson
The US dollar has been firm, but the drivers behind the move may be more complex than they first appear.
While geopolitical tension and shifts in risk sentiment play a role, current price behaviour seems increasingly influenced by inflation expectations