


Musk Could Earn a Trillion: How Are Tesla (TSLA) Shares Reacting?
FXOpen

According to media reports, earlier this month Tesla shareholders approved a new 10-year compensation package for Elon Musk worth up to $1 trillion. But is this good or bad news for TSLA shares?
→ On the plus side, Musk is now firmly “tied” to the company and highly motivated to achieve extraordinary goals — such as reaching a market capitalisation of $8.5 trillion and launching mass production of Optimus robots.
→ On the downside, the price of this decision could be high. The targets appear almost fantastical, and their achievement would mean dilution of existing shareholders’ stakes through the issuance of new options.
As a result, Tesla’s share price has been fluctuating, reflecting market indecision and consolidating after the news. A closer look at the TSLA chart offers clues as to what may happen next.
Technical Analysis of TSLA
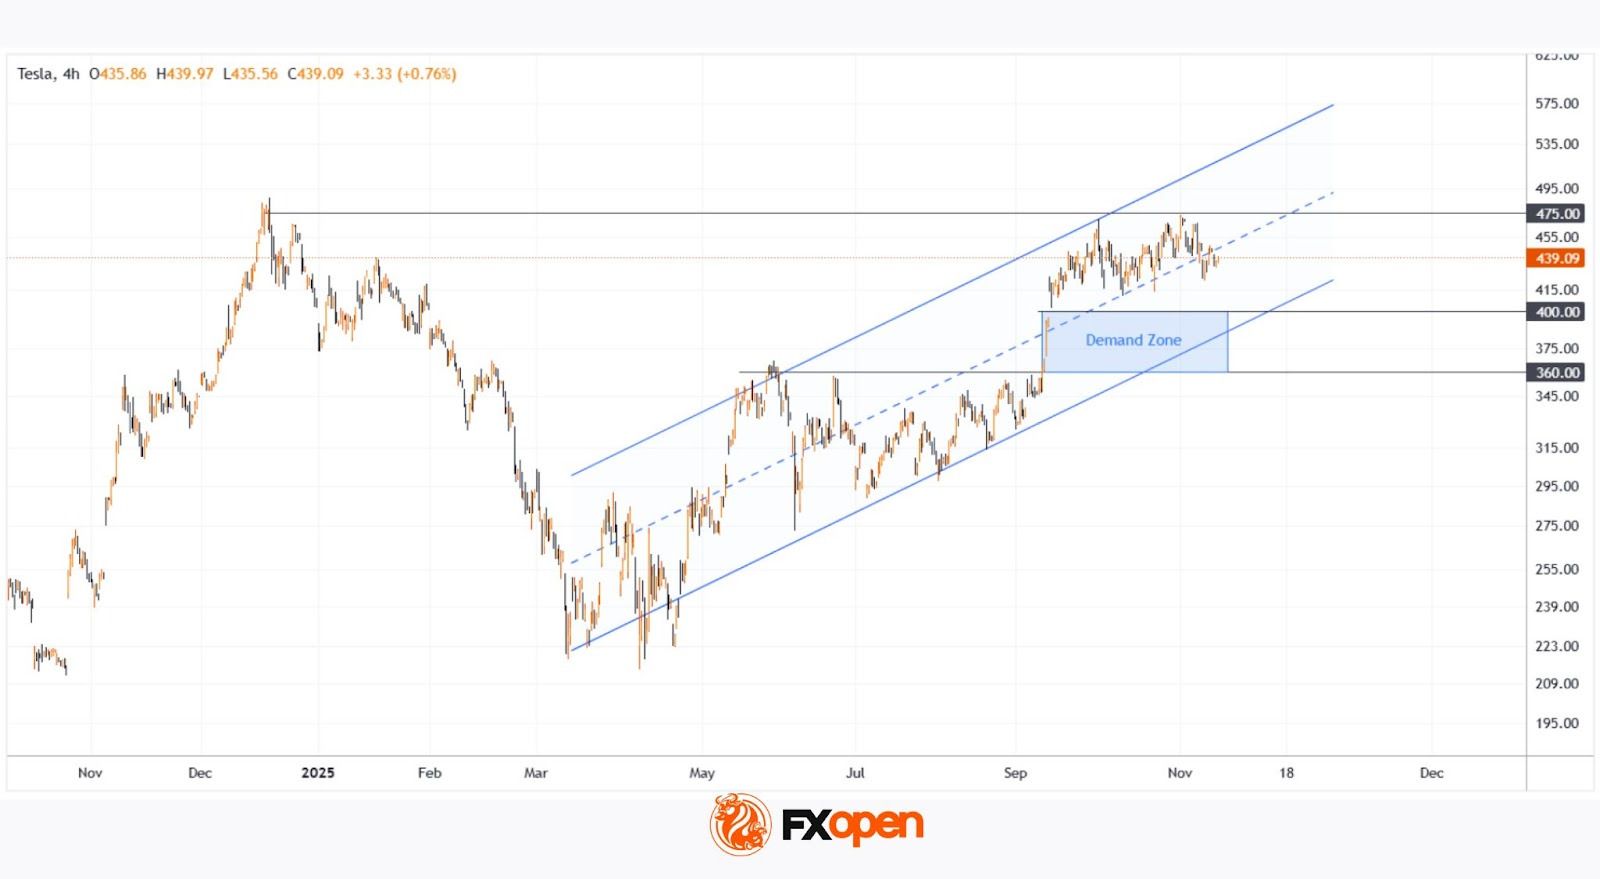
From a bullish perspective, Tesla’s share price remains within an upward-sloping trend channel, where:
→ the median line is showing signs of acting as support;
→ the sharp rally in September formed a demand zone, where an imbalance between buyers and sellers triggered a strong move higher — the upper boundary of this channel, around the psychological $400 mark, could act as a support level going forward.
From a bearish point of view, the key barrier remains the current all-time high, which continues to cap the ongoing rally (roughly +100% from this year’s low).
Given these factors, it is reasonable to assume that TSLA is currently in a consolidation phase. The situation could eventually resolve in favour of the bulls if the price holds the lower boundary of the channel — as seen previously, when a similar consolidation period preceded a breakout above the $360 resistance level.
Buy and sell stocks of the world's biggest publicly-listed companies with CFDs on FXOpen’s trading platform. Open your FXOpen account now or learn more about trading share CFDs with FXOpen.
This article represents the opinion of the Companies operating under the FXOpen brand only. It is not to be construed as an offer, solicitation, or recommendation with respect to products and services provided by the Companies operating under the FXOpen brand, nor is it to be considered financial advice.
Stay ahead of the market!
Subscribe now to our mailing list and receive the latest market news and insights delivered directly to your inbox.


Latest articles

US Dollar Index: A Defining Week for the King of the Markets
The dollar heads into a pivotal week trading near 101.80, just off a 15-month high, with the Fed's July 29 meeting standing as the clear focal point. Markets currently price roughly a 65% chance of a hold, though renewed

NZD/USD: Inflation Surge Meets Strong US Dollar Pressure
On 21 July, Stats NZ reported an acceleration in inflation: the Consumer Price Index rose 1.5% in the second quarter, while the annual inflation rate climbed to 4.1%, its highest level in more than two years and slightly

Weekly Market Insights with Gary Thomson: The Week of Central Banks and Earnings
In this video, we’ll explore the key economic events and market trends, shaping the financial landscape. Get ready for insights into financial markets to help you navigate the week ahead. Let’s dive in!
In this episode of Market