


Nasdaq 100 Consolidates Ahead of Nvidia Report
FXOpen

Today, after the main trading session ends, Nvidia (NVDA) – the second-largest company by market capitalisation and the leader of 2024 amid the AI boom – will release its second-quarter earnings report.
It’s reasonable to assume that market participants are anticipating this event, which will likely trigger a surge in market volatility:
→ Nvidia shares (NVDA) have been fluctuating within the $123.50 – $131.00 range since 19 August;
→ Signs of anticipation are also evident on the technology index chart.
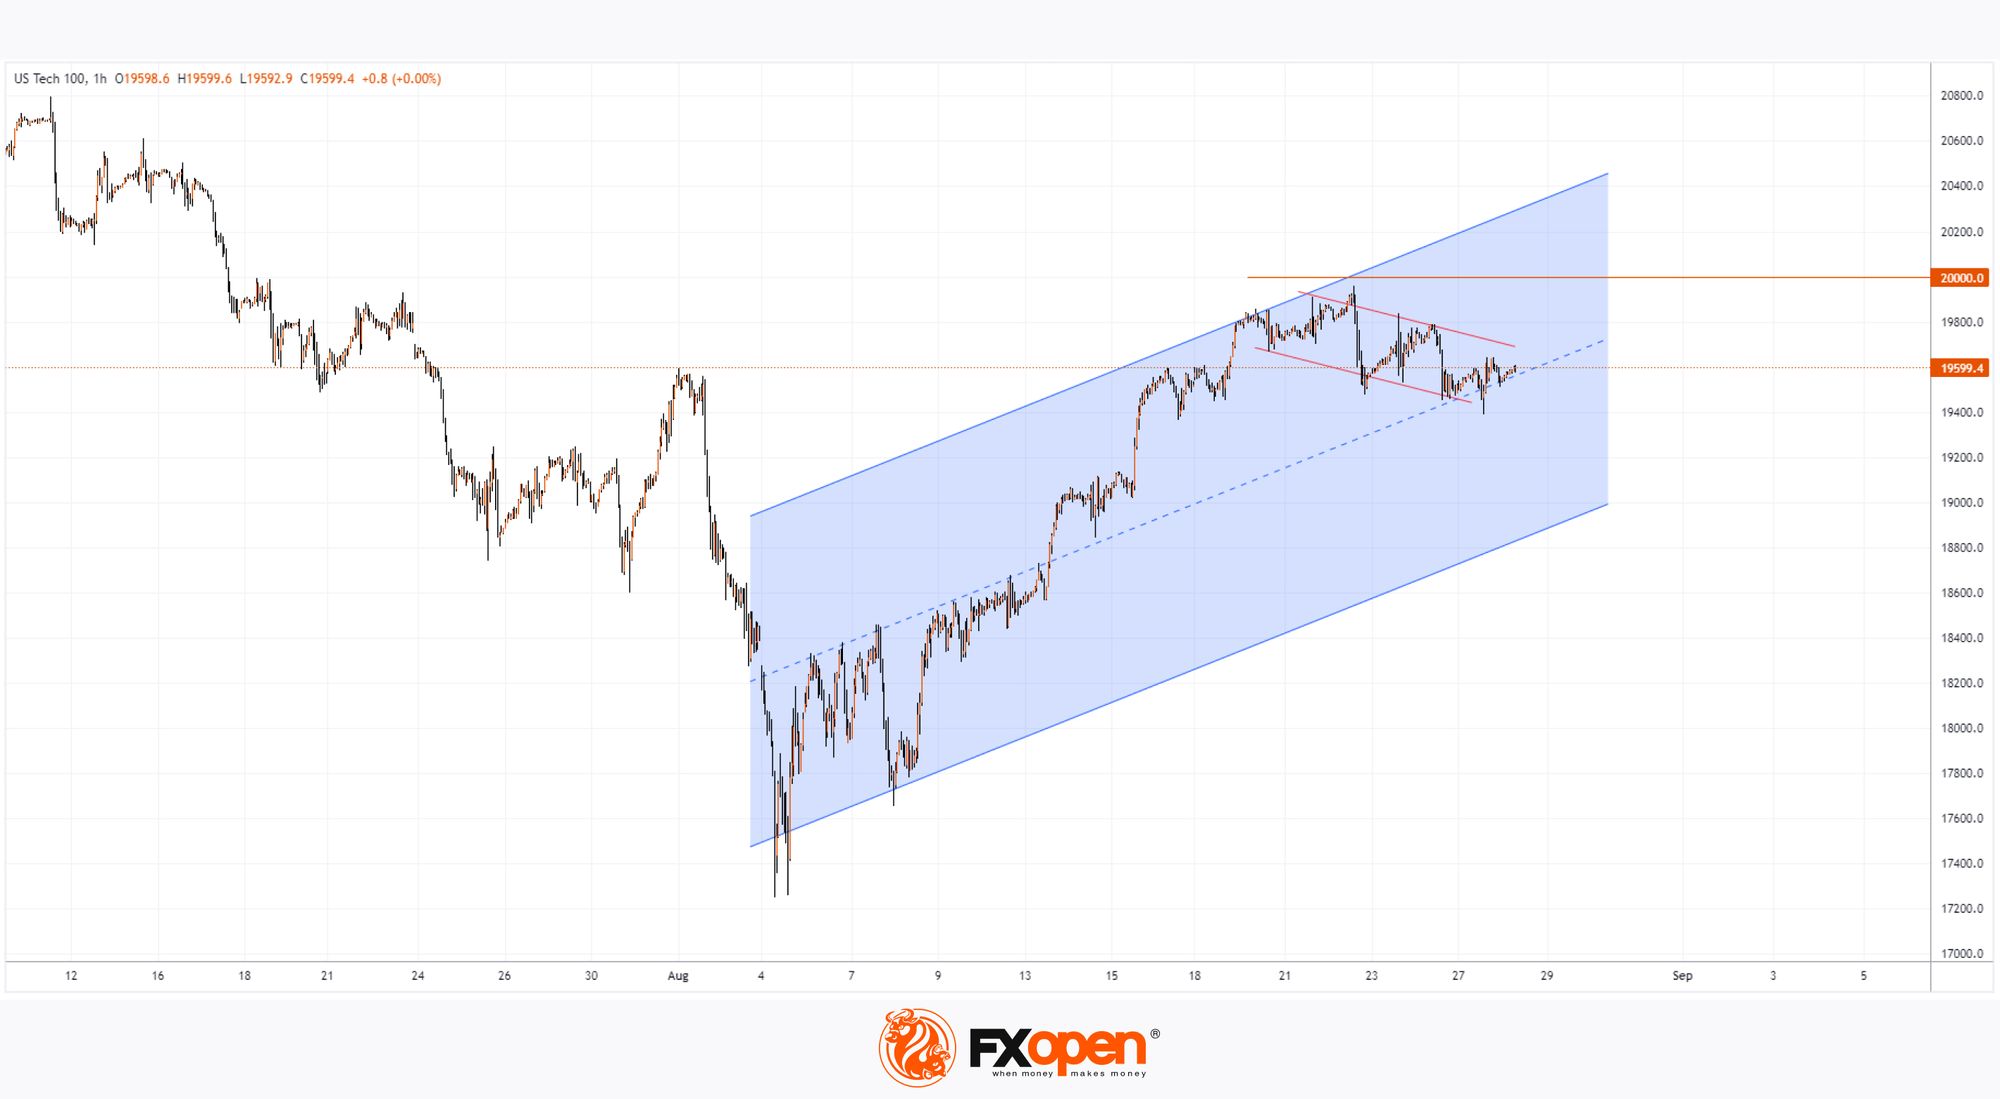
A technical analysis of the Nasdaq 100 chart (US Tech 100 mini on FXOpen) shows that:
→ Starting from the 3-month low formed on 5 August, the recovery has created an ascending channel (shown in blue) – with the price in the upper half of the channel, indicating steady demand.
→ However, as the NVDA earnings report approaches, the price has retreated from the upper boundary and dropped towards the median (as indicated by the red lines). This could suggest a Bullish Flag pattern (a pattern of intermediate correction within an uptrend).
→ A concerning factor is that the growth rate slowed after the price surpassed the 1 August high. The psychological level of 20,000 points could also be acting as a barrier to further growth within the blue channel.
In the event of a strong Nvidia (NVDA) report, the Nasdaq 100 index price (US Tech 100 mini on FXOpen) could break out of the Bullish Flag and continue its upward movement within the ascending channel. However, if the company disappoints, the price could drop to the lower boundary of the channel or even attempt a bearish breakout.
Trade global index CFDs with zero commission and tight spreads (additional fees may apply). Open your FXOpen account now or learn more about trading index CFDs with FXOpen.
This article represents the opinion of the Companies operating under the FXOpen brand only. It is not to be construed as an offer, solicitation, or recommendation with respect to products and services provided by the Companies operating under the FXOpen brand, nor is it to be considered financial advice.
Stay ahead of the market!
Subscribe now to our mailing list and receive the latest market news and insights delivered directly to your inbox.


Latest articles

AUD/CAD: Months of Indecision — Is a Breakout Finally Coming?
The Australian dollar has clawed back most of its end-of-June losses, when it touched three-month lows against the greenback amid escalating Middle East tensions. Since then, sentiment has improved: the RBA's Assistant Governor Sarah Hunter signalled the board stands ready

USD/JPY: Battling at the Top of the Triangle
On 3 July, Japan's Finance Minister, Satsuki Katayama, stated that the Ministry of Finance remains in close contact with US authorities regarding developments in USD/JPY as the yen traded near its weakest level in almost 40 years. Similar verbal

Dow Jones (DJIA): Consolidation Beyond the Trend
Federal Reserve Chair Kevin Warsh testified before Congress on 14–15 July, reaffirming the Fed's commitment to bringing inflation back to target while providing no clear guidance on the future path of interest rates. Meanwhile, June inflation data came in