


FXOpen

On 17th December, analysing the Nasdaq 100 chart (US Tech 100 mini on FXOpen), we:
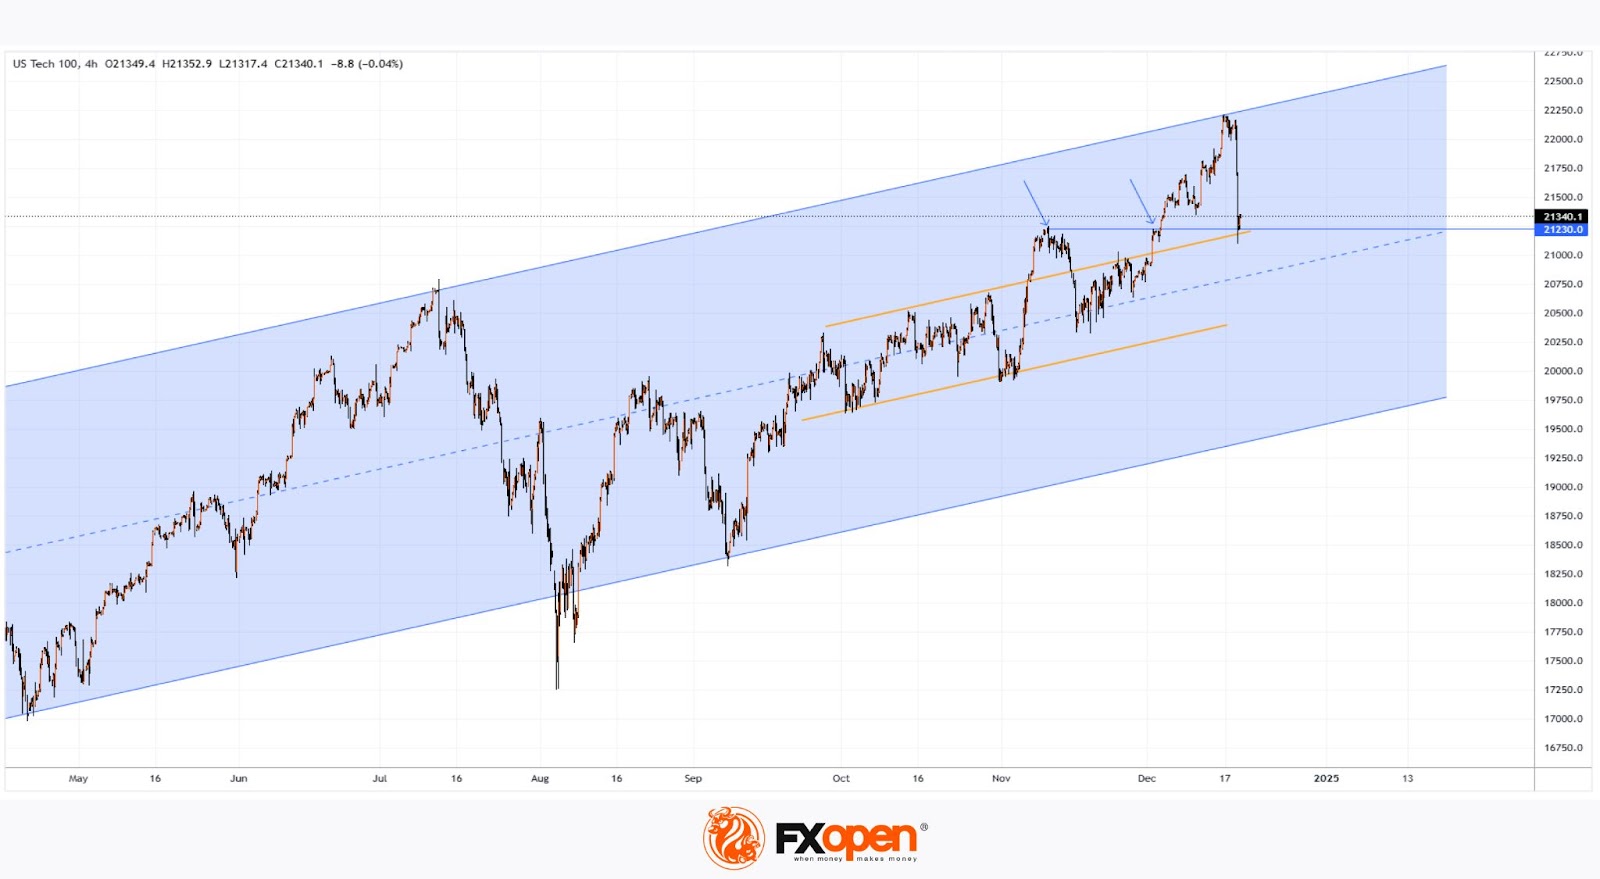
→ Drew a blue upward channel relevant for 2024;
→ Noted that the price was near the upper boundary of the channel, while the RSI indicator had entered the overbought zone;
→ Suggested that bulls might face difficulties in pushing the price to a new all-time high.
Yesterday, the Fed cut the interest rate by 0.25%. Although it was anticipated, the market reaction was sharply negative. The Nasdaq 100 (US Tech 100 mini on FXOpen) dropped by approximately 4%.
The steep market reaction was driven by Fed Chair Jerome Powell’s comments during the press conference, where he stated that the FOMC plans to cut rates only twice in 2025, contrary to market expectations of four cuts.
Technical analysis of the Nasdaq 100 (US Tech 100 mini on FXOpen) chart shows that:
→ The price remains in the upper half of the channel, supported by the 21,230 level, which previously acted as resistance (as indicated by arrows).
→ We can assume that the area around the median of the blue channel (marked by orange lines) could act as a barrier to further downward momentum, as medians often serve as equilibrium zones where supply and demand balance out.
What’s next? According to analysts at Zacks, record highs for the tech stock index may not be a topic of discussion in the near future.
There is a possibility that a local descending channel could form, potentially driving the price into the lower half of the broader upward channel.
Trade global index CFDs with zero commission and tight spreads (additional fees may apply). Open your FXOpen account now or learn more about trading index CFDs with FXOpen.
This article represents the opinion of the Companies operating under the FXOpen brand only. It is not to be construed as an offer, solicitation, or recommendation with respect to products and services provided by the Companies operating under the FXOpen brand, nor is it to be considered financial advice.
Stay ahead of the market!
Subscribe now to our mailing list and receive the latest market news and insights delivered directly to your inbox.


Latest articles

Market Analysis: GBP/USD Dips Further As EUR/GBP Regains Traction
GBP/USD failed to climb above 1.3500 and corrected some gains. EUR/GBP started a decent increase and might aim for more gains above 0.8700.
Important Takeaways for GBP/USD and EUR/GBP Analysis Today
· The British Pound


Market Insights with Gary Thomson: Oil, US Retail Sales & NFP in Focus
In this video, we’ll explore the key economic events and market trends, shaping the financial landscape. Get ready for insights into financial markets to help you navigate the week ahead. Let’s dive in!
In this episode of Market