


Nasdaq 100 Reaches Record High
FXOpen

On 29th October, analysing the Nasdaq 100 (US Tech 100 mini on FXOpen) chart, we:
→ Drew a blue upward channel relevant for 2024.
→ Noted that the price was in a consolidation phase (indicated by narrowing purple lines) at the channel's median, suggesting a potential balance of supply and demand forces.
→ Warned that earnings season could trigger a volatility spike.
→ Suggested that the price was likely heading toward a new all-time high.
Since then:
→ Amid company earnings reports, we observed a volatility spike in November, which was further amplified by the release of US presidential election results.
→ The index achieved a new all-time high.
The Nasdaq 100 (US Tech 100 mini on FXOpen) chart shows that the index surpassed the $22,000 level for the first time yesterday. This was supported by positive trader sentiment ahead of tomorrow's Fed interest rate decision. According to Forex Factory, the rate will be cut by another 25 basis points (returning to the February 2023 level).
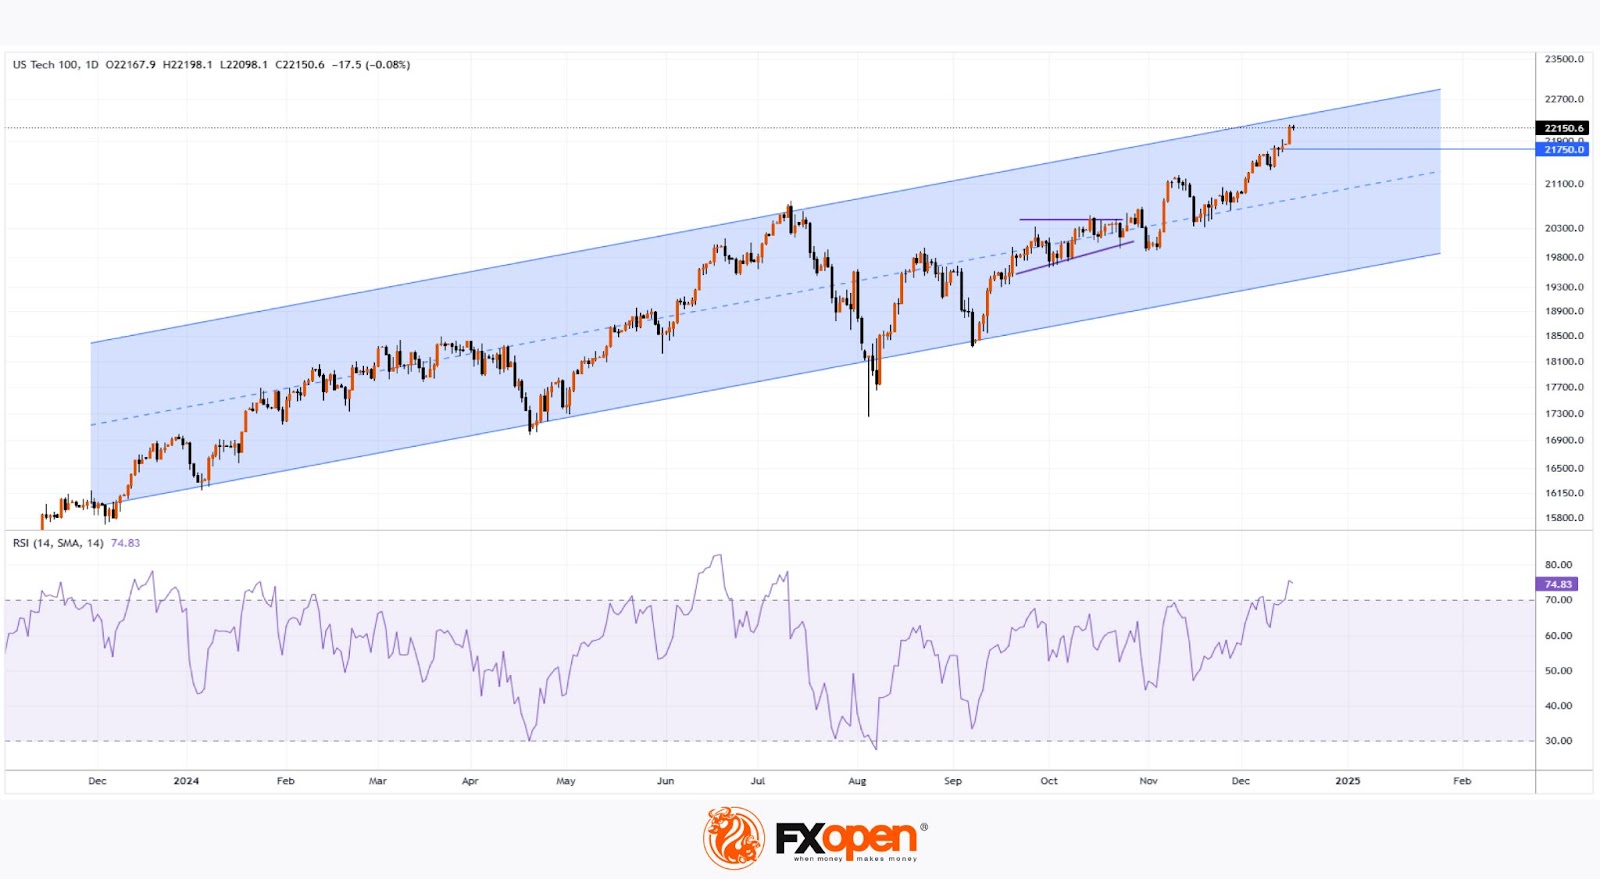
Meanwhile, the technical analysis of the Nasdaq 100 (US Tech 100 mini on FXOpen) reveals that:
→ The price has approached the upper boundary of the upward channel, which could serve as strong resistance.
→ Since early December, the index has risen by approximately 5.5%, and the RSI indicator has entered the overbought zone for the first time since July.
Under such conditions, bulls may struggle to continue the upward momentum, as more investors might look to lock in profits ahead of the holiday season. Additionally, the market's reaction to tomorrow's Fed interest rate release at 21:00 GMT+2 may play a key role.
Trade global index CFDs with zero commission and tight spreads (additional fees may apply). Open your FXOpen account now or learn more about trading index CFDs with FXOpen.
This article represents the opinion of the Companies operating under the FXOpen brand only. It is not to be construed as an offer, solicitation, or recommendation with respect to products and services provided by the Companies operating under the FXOpen brand, nor is it to be considered financial advice.
Stay ahead of the market!
Subscribe now to our mailing list and receive the latest market news and insights delivered directly to your inbox.


Latest articles

Nasdaq 100: 48 Hours of Chaos, One Trendline Standing in the Way
Wall Street just lived through one of its wildest 48 hours of the year. On Wednesday, the Fed held rates steady at 3.50%-3.75%, but three FOMC members broke ranks to demand a hike—an unusually hawkish dissent

Amazon Analysis: Strong Earnings Coincide with a Breakout from the Correction
On 30 July, Amazon.com reported its financial results for the second quarter of 2026, significantly exceeding market expectations. Revenue rose 20% year-on-year to $200.6 billion, compared with the consensus forecast of around $196.5 billion. The main growth

GBP/USD and EUR/GBP Await Key Bank of England Decision
The pound strengthened following the outcome of the US Federal Reserve meeting, where the central bank, as expected, kept interest rates unchanged. However, the Fed did not provide the market with clear signals of an imminent shift towards rate cuts,