


NASDAQ Falls by 1.5% after Tech Giants Reports
FXOpen
NASDAQ E-Mini futures fell 1.5% in early trading after the publication of quarterly earnings reports from technology giants Google (GOOG), Microsoft (MSFT) and Advanced Micro Devices (AMD):
→ The parent company of Google, Alphabet Inc., reported revenue of 86.3 billion dollars (forecast = 85.2), however, the slowdown in advertising revenue – the most important article in the company's revenue – caused the price of GOOG shares to drop by 2.7% after publication report
→ Microsoft's revenue amounted to 62.0 billion US dollars, increasing by 10% (forecast = 61.2 billion). Despite the high performance of the cloud segment Azure, the price of Microsoft shares decreased by 3.2% after the publication. Perhaps the MSFT stock market is overbought due to the extreme optimism associated with AI implementation.
→ AMD, the leading semiconductor manufacturing company, also exceeded expectations. Its income was 6.16 billion US dollars (forecast = 6.12). However, the company made a cautious forecast for the next quarter. The price of AMD shares fell by 4.5%.
The cumulative effect of these messages strongly influenced the price of the NASDAQ E-Mini index. Perhaps the market is “letting off steam” after the impressive growth that began in 2023. MarketWatch conveys the opinions of JPMorgan analysts — they believe that today's stock market, which is dominated by large technology companies, has signs of a dotcom bubble.
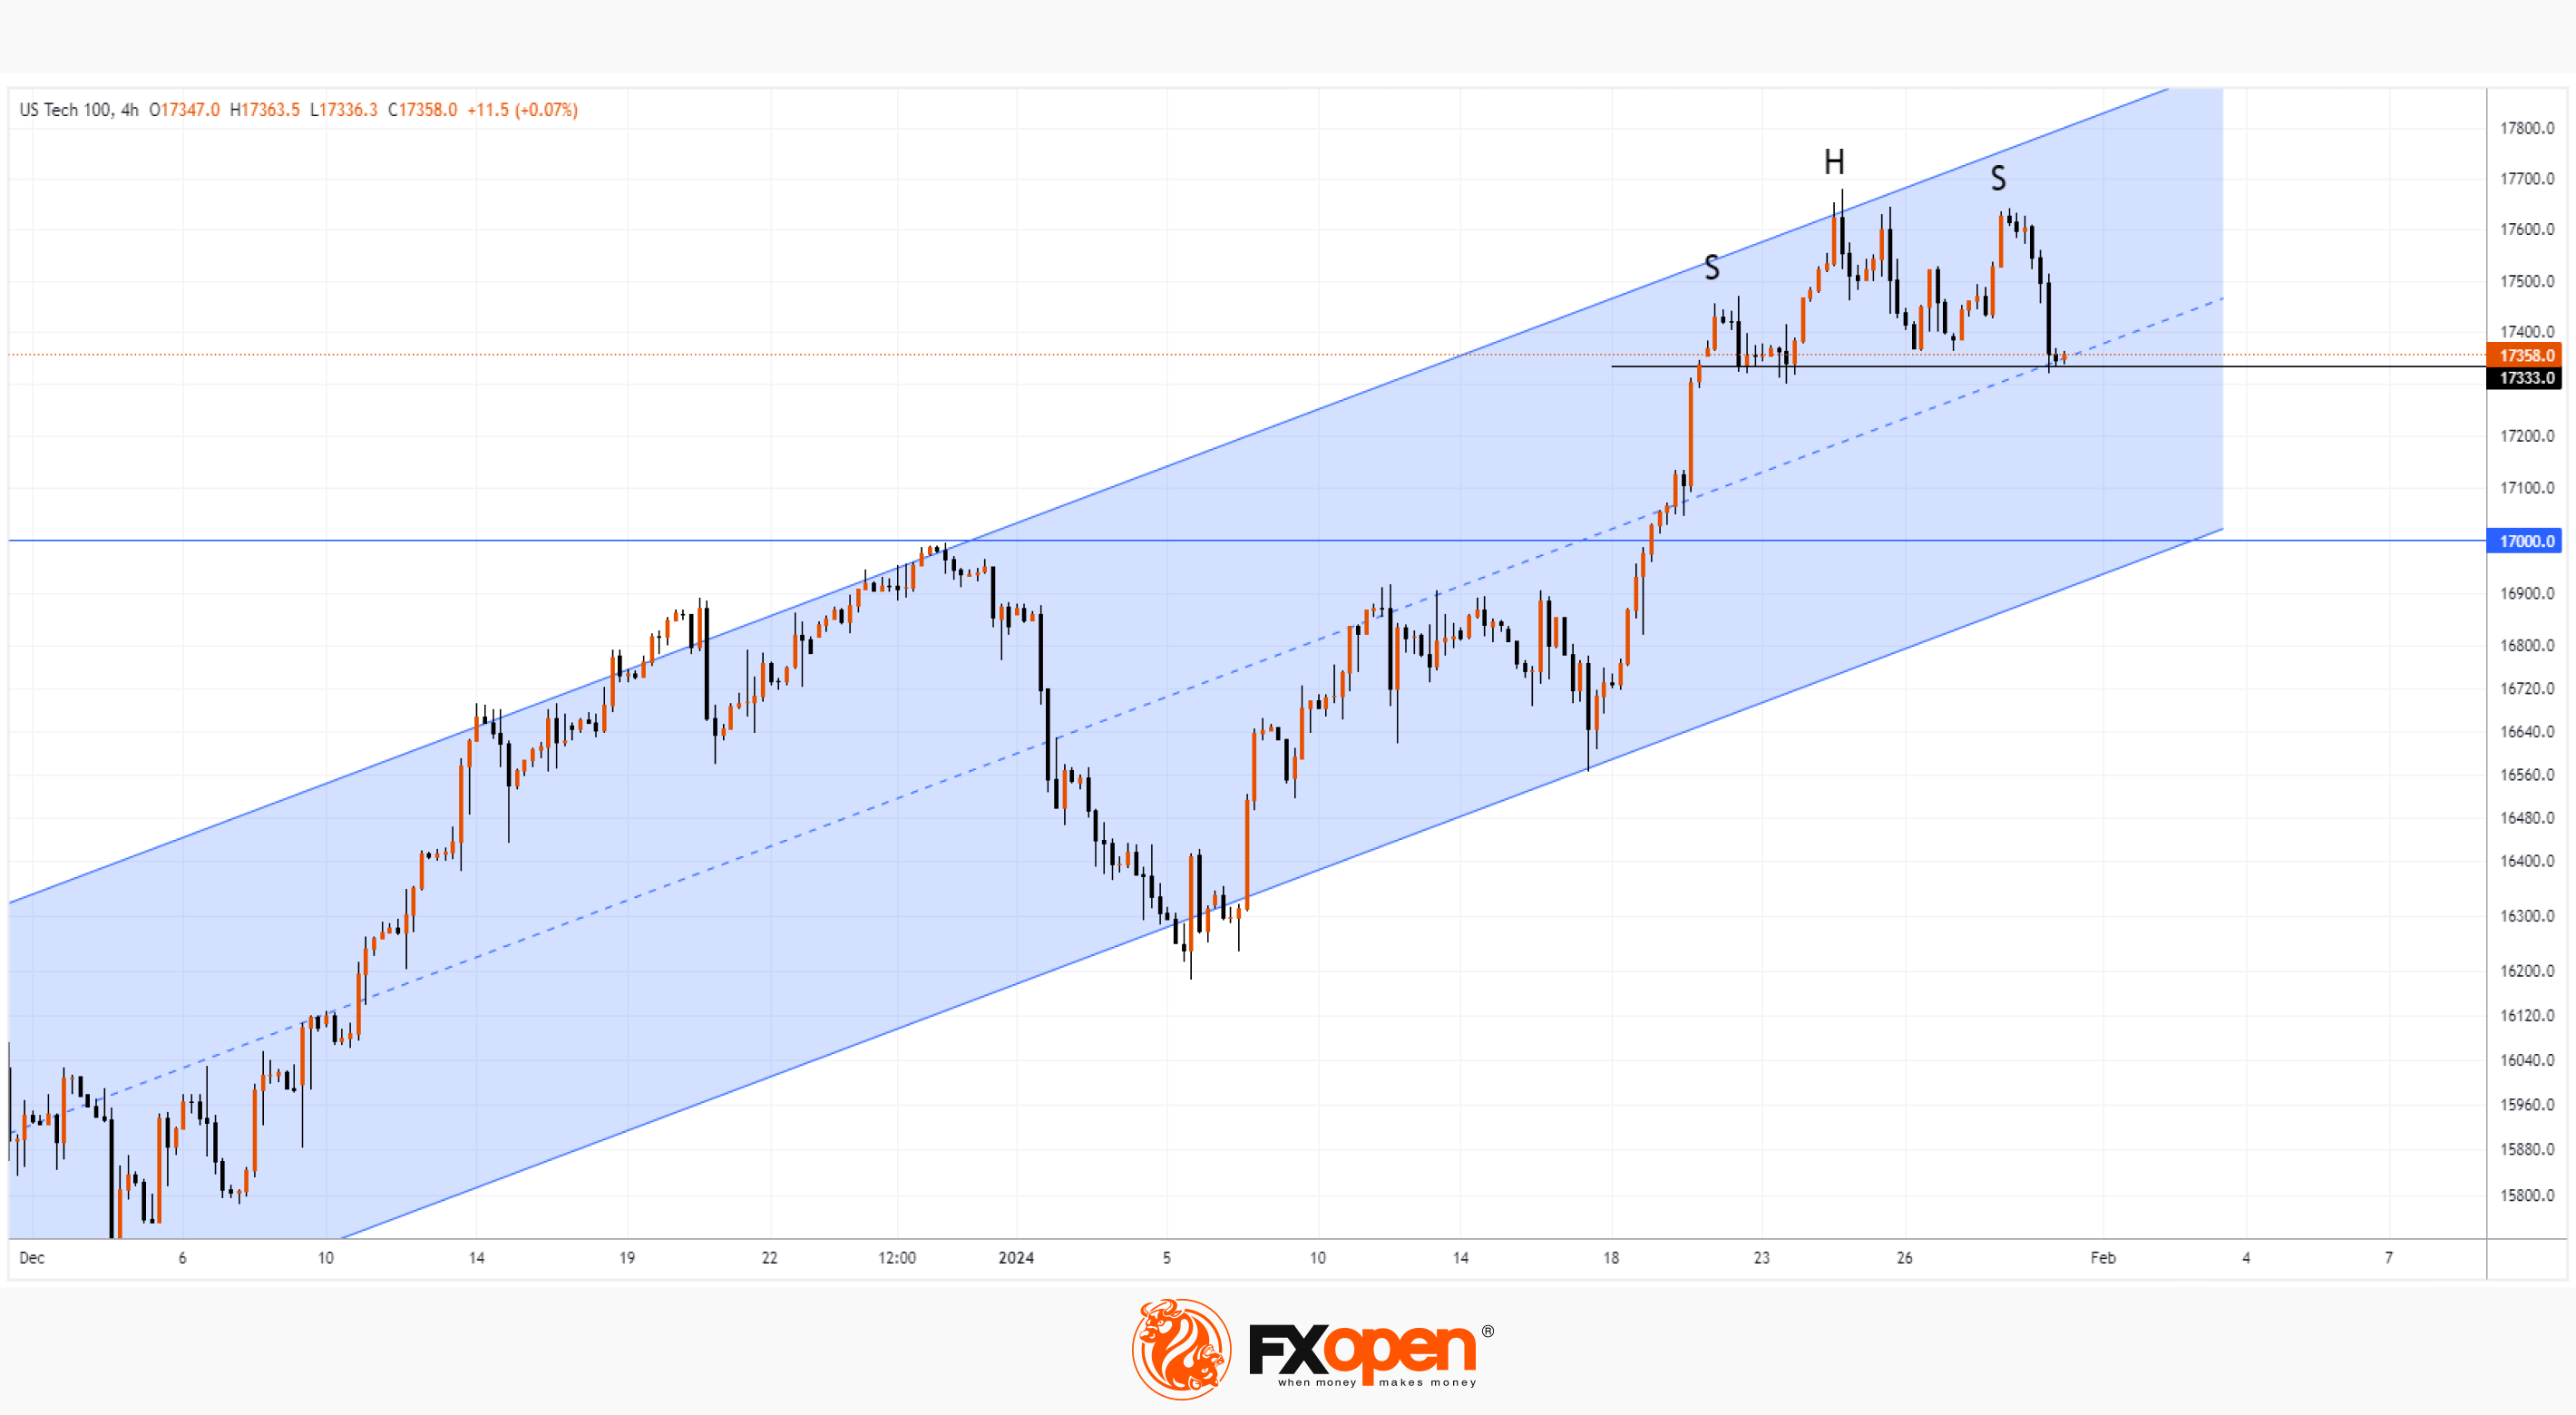
The NASDAQ 100 chart shows that:
→ price forms a bear pattern head-and-shoulders;
→ the price is located near the support block, which forms the median line of the ascending channel (shown in blue) and the support level is 17333.
If bearish sentiments intensify at the opening of the main trading session, the bears can break through the specified support block and direct the price to the block that forms the psychological level of 17,000 and the lower border of the channel.
Trade global index CFDs with zero commission and tight spreads (additional fees may apply). Open your FXOpen account now or learn more about trading index CFDs with FXOpen.
This article represents the opinion of the Companies operating under the FXOpen brand only. It is not to be construed as an offer, solicitation, or recommendation with respect to products and services provided by the Companies operating under the FXOpen brand, nor is it to be considered financial advice.
Stay ahead of the market!
Subscribe now to our mailing list and receive the latest market news and insights delivered directly to your inbox.


Latest articles

EUR/USD and GBP/USD consolidate ahead of the Fed decision
European currencies are showing subdued dynamics, entering a consolidation phase following their previous advance. Earlier, EUR/USD and GBP/USD broke out of their ranges and strengthened; however, the subsequent correction has led both pairs to retest the previously breached

Meta: V-Shaped Recovery Meets Heavy Volume Resistance
The movement in Meta Platforms shares is being driven by two competing narratives. On one hand, advertising revenue is benefiting from AI-based tools: the Advantage+ platform continues to support strong advertiser demand, and the analyst consensus for Q1 2026 revenue

Commodity Currencies Test Key Levels Ahead of Major Macro Data
Commodity-linked currencies are trading near key levels, showing restrained price action as market participants adopt a wait-and-see approach. The fundamental backdrop is shaped by expectations surrounding the release of Australia’s inflation data and the Bank of Canada’s interest