


FXOpen

On 26 September, when analysing the XNG/USD natural gas price chart, we noted that:
→ Bulls might be "gathering strength" for a potential attempt to break the psychological level of 3.00.
→ If successful, this would pave the way towards the yearly high around 3.20.
Since then, the price of natural gas:
→ Broke above the 3.00 level on 27 September;
→ Reached 3.20 on 4 October, after which it reversed downward.
Bearish sentiment was driven by:
→ News that Hurricane Helen had minimal impact on natural gas processing facilities along the U.S. Gulf Coast;
→ Adequate gas reserves ensuring sufficient supply;
→ Weather forecasts indicating short-term gas demand at the end of September.
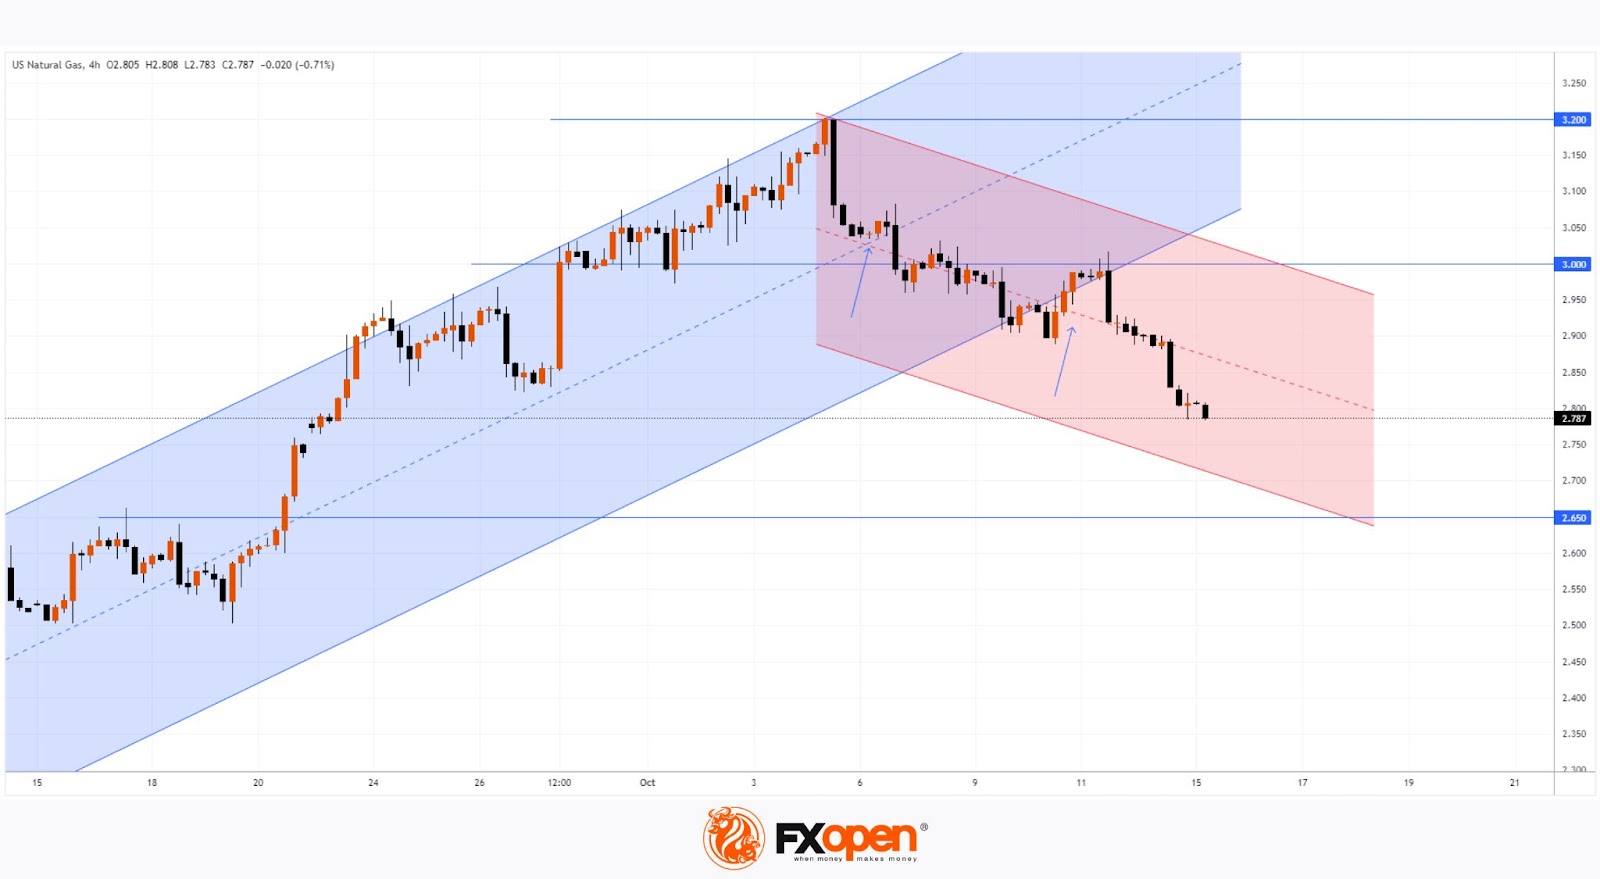
Technical analysis of the XNG/USD chart shows the upward channel (marked in blue) has lost relevance. It’s evident that:
→ The bounce from the median line (shown by the first arrow) was weak;
→ The attempt to re-enter the channel from its lower boundary (as shown by the second arrow) led to a test of the 3.00 psychological level, which acted as resistance.
There are no signs yet of bulls trying to regain control on the XNG/USD chart. If the supply and demand balance remains unchanged, the natural gas price may continue its decline within the red downward channel, possibly towards its lower boundary, reinforced by the former resistance at 2.65.
Start trading commodity CFDs with tight spreads. Open your trading account now or learn more about trading commodity CFDs with FXOpen.
This article represents the opinion of the Companies operating under the FXOpen brand only. It is not to be construed as an offer, solicitation, or recommendation with respect to products and services provided by the Companies operating under the FXOpen brand, nor is it to be considered financial advice.
Stay ahead of the market!
Subscribe now to our mailing list and receive the latest market news and insights delivered directly to your inbox.


Latest articles

The US Dollar Index (DXY) Rebounds from a Two-Month Low
A week ago, we:
→ updated a system of two trend channels;
→ identified signs of selling pressure dominance;
→ outlined a scenario in which price could slide towards the lower boundary of the blue channel, potentially acting as key support.
As the

Tesla (TSLA) Shares Close at a Record High
On Tuesday, 16 December 2025, Tesla shares closed at a new all-time high, breaking above the $488 level.
As a result, TSLA:
→ surpassed its December 2024 peak;
→ is up by roughly 125% from this year’s lows;
→ made Elon Musk

USD/JPY and USD/CAD Under Pressure After Weak US Labour Market Data
The US jobs report for November, released yesterday, reinforced the downward momentum in the dollar. The Department of Labor reported that non-farm payrolls rose by just 64,000, only slightly above analysts’ expectations and signalling a fragile recovery in the