


Natural Gas Price Hits 3-Month High
FXOpen

According to today's XNG/USD chart, the price of natural gas:
→ has risen by approximately 30% since the beginning of September;
→ is currently around the 2.95 level – the last time the price was at this level was at the end of June this year.
Bullish sentiment is supported by:
→ forecasts of a warmer autumn, which is increasing demand for natural gas to power air conditioning systems;
→ concerns related to Hurricane Helen in the US Gulf of Mexico. According to the EIA, 5% of total US dry natural gas production comes from the Gulf of Mexico, and 51% of the total capacity of US natural gas processing plants is located along the US Gulf Coast.
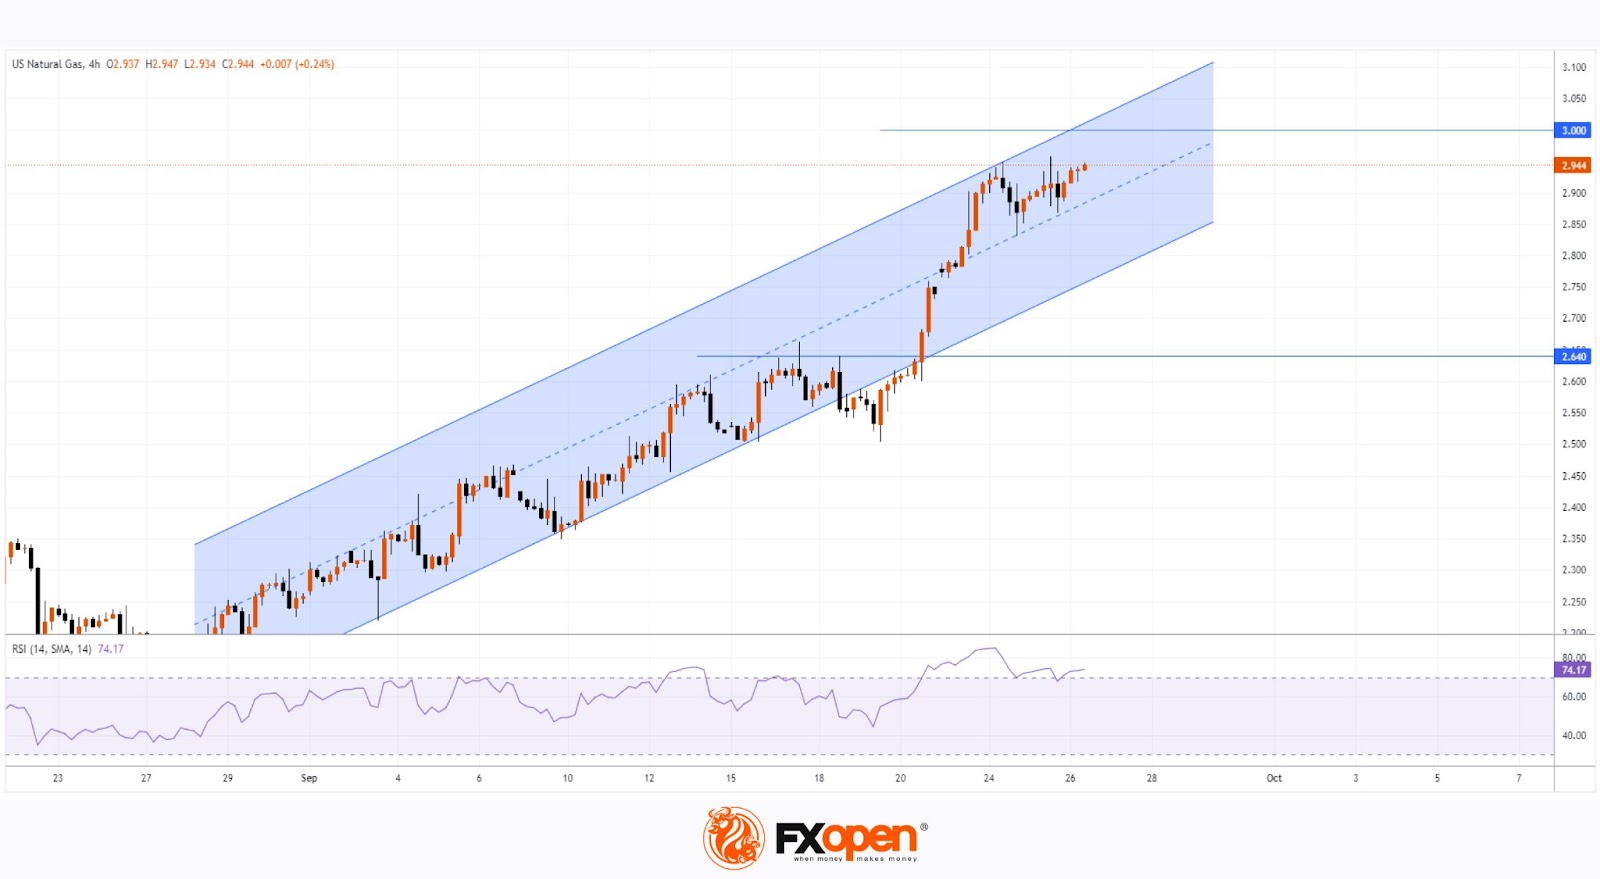
Technical analysis of the XNG/USD chart shows that in September, the price has been moving within an ascending channel (marked in blue).
It is noticeable that from the 20th onwards, demand forces have intensified, leading to the following:
→ the price broke through the 2.64 resistance level;
→ the price moved to the upper half of the ascending channel, after which its median line began to show signs of support;
→ the RSI indicator reached overbought territory.
Currently, there are no signs on the XNG/USD chart of bears attempting to seize control, while the bulls may be "gathering strength" for a possible attempt to break through the psychological level of 3.00. If this happens and is successful, it could pave the way towards the yearly high in the 3.20 region
Start trading commodity CFDs with tight spreads (additional fees may apply). Open your trading account now or learn more about trading commodity CFDs with FXOpen.
This article represents the opinion of the Companies operating under the FXOpen brand only. It is not to be construed as an offer, solicitation, or recommendation with respect to products and services provided by the Companies operating under the FXOpen brand, nor is it to be considered financial advice.
Stay ahead of the market!
Subscribe now to our mailing list and receive the latest market news and insights delivered directly to your inbox.


Latest articles

AUD/CAD: Months of Indecision — Is a Breakout Finally Coming?
The Australian dollar has clawed back most of its end-of-June losses, when it touched three-month lows against the greenback amid escalating Middle East tensions. Since then, sentiment has improved: the RBA's Assistant Governor Sarah Hunter signalled the board stands ready

USD/JPY: Battling at the Top of the Triangle
On 3 July, Japan's Finance Minister, Satsuki Katayama, stated that the Ministry of Finance remains in close contact with US authorities regarding developments in USD/JPY as the yen traded near its weakest level in almost 40 years. Similar verbal

Dow Jones (DJIA): Consolidation Beyond the Trend
Federal Reserve Chair Kevin Warsh testified before Congress on 14–15 July, reaffirming the Fed's commitment to bringing inflation back to target while providing no clear guidance on the future path of interest rates. Meanwhile, June inflation data came in