


Natural Gas Price Drops Over 8% Since the Start of the Month
FXOpen

On 26 September, when analysing the XNG/USD natural gas price chart, we noted that:
→ Bulls might be "gathering strength" for a potential attempt to break the psychological level of 3.00.
→ If successful, this would pave the way towards the yearly high around 3.20.
Since then, the price of natural gas:
→ Broke above the 3.00 level on 27 September;
→ Reached 3.20 on 4 October, after which it reversed downward.
Bearish sentiment was driven by:
→ News that Hurricane Helen had minimal impact on natural gas processing facilities along the U.S. Gulf Coast;
→ Adequate gas reserves ensuring sufficient supply;
→ Weather forecasts indicating short-term gas demand at the end of September.
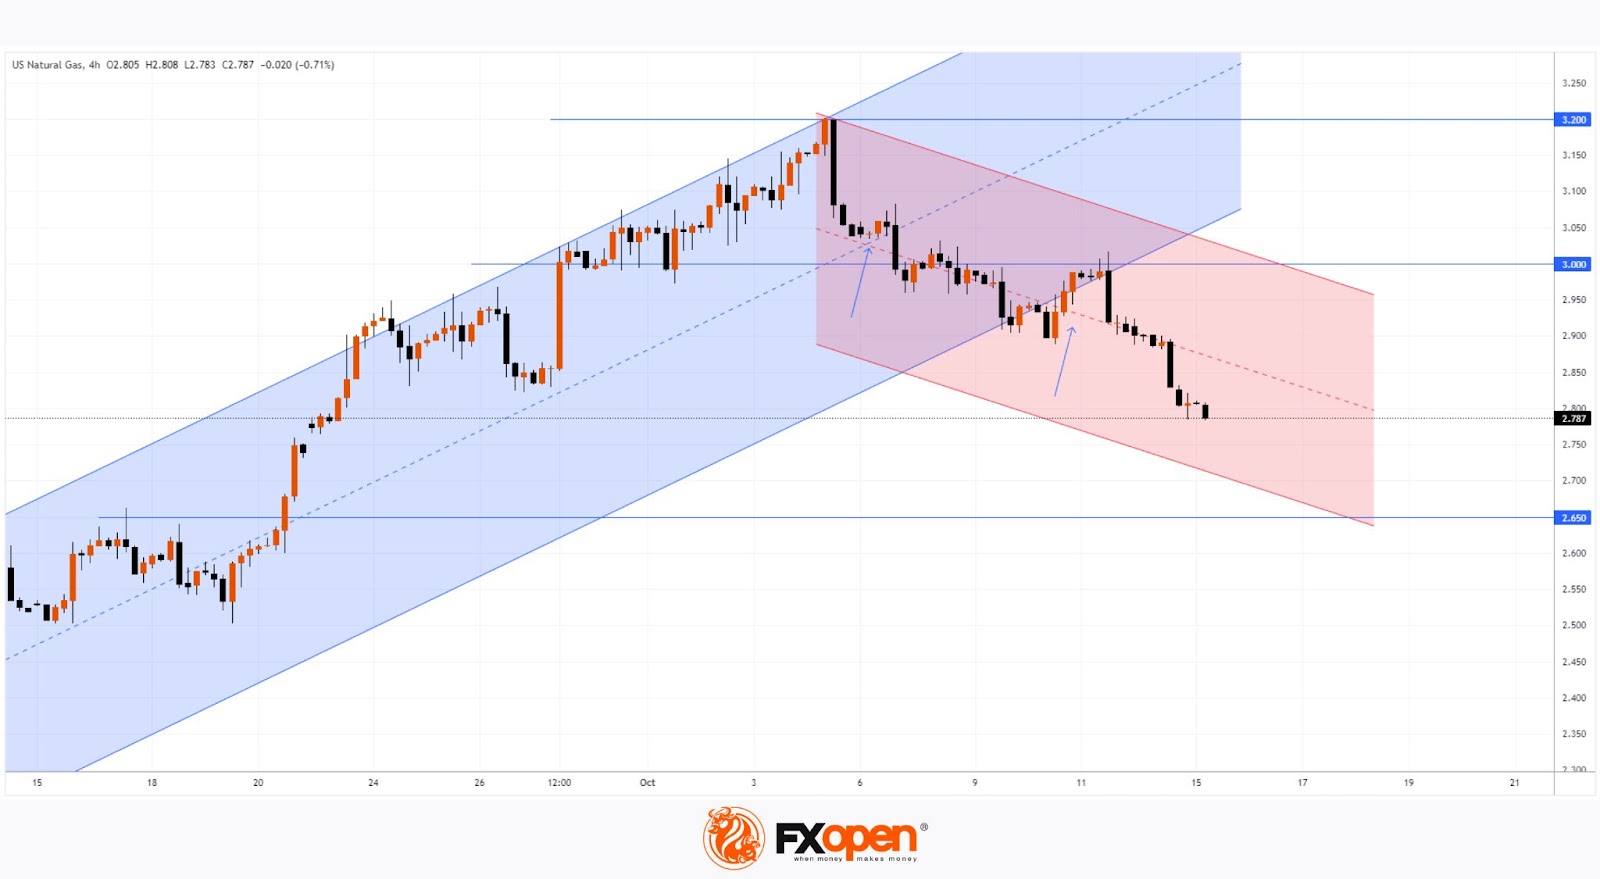
Technical analysis of the XNG/USD chart shows the upward channel (marked in blue) has lost relevance. It’s evident that:
→ The bounce from the median line (shown by the first arrow) was weak;
→ The attempt to re-enter the channel from its lower boundary (as shown by the second arrow) led to a test of the 3.00 psychological level, which acted as resistance.
There are no signs yet of bulls trying to regain control on the XNG/USD chart. If the supply and demand balance remains unchanged, the natural gas price may continue its decline within the red downward channel, possibly towards its lower boundary, reinforced by the former resistance at 2.65.
Start trading commodity CFDs with tight spreads (additional fees may apply). Open your trading account now or learn more about trading commodity CFDs with FXOpen.
This article represents the opinion of the Companies operating under the FXOpen brand only. It is not to be construed as an offer, solicitation, or recommendation with respect to products and services provided by the Companies operating under the FXOpen brand, nor is it to be considered financial advice.
Stay ahead of the market!
Subscribe now to our mailing list and receive the latest market news and insights delivered directly to your inbox.


Latest articles

FTSE 100: Correction Has Ended, but a New Impulse Has Yet to Form
Fundamental backdrop
The UK inflation report for April, published on 20 May, delivered unexpectedly positive figures: annual inflation slowed to 2.8% in April 2026 from 3.3% in March, coming in below the consensus forecast of 3.0% and

Candlestick Wick Analysis in Trading
Candlestick wicks often contain critical information about buying and selling pressure that body patterns alone may not

Market Structure Shift (MSS) in Trading
A Market Structure Shift (MSS) is an ICT trading concept used to identify potential changes