


FXOpen

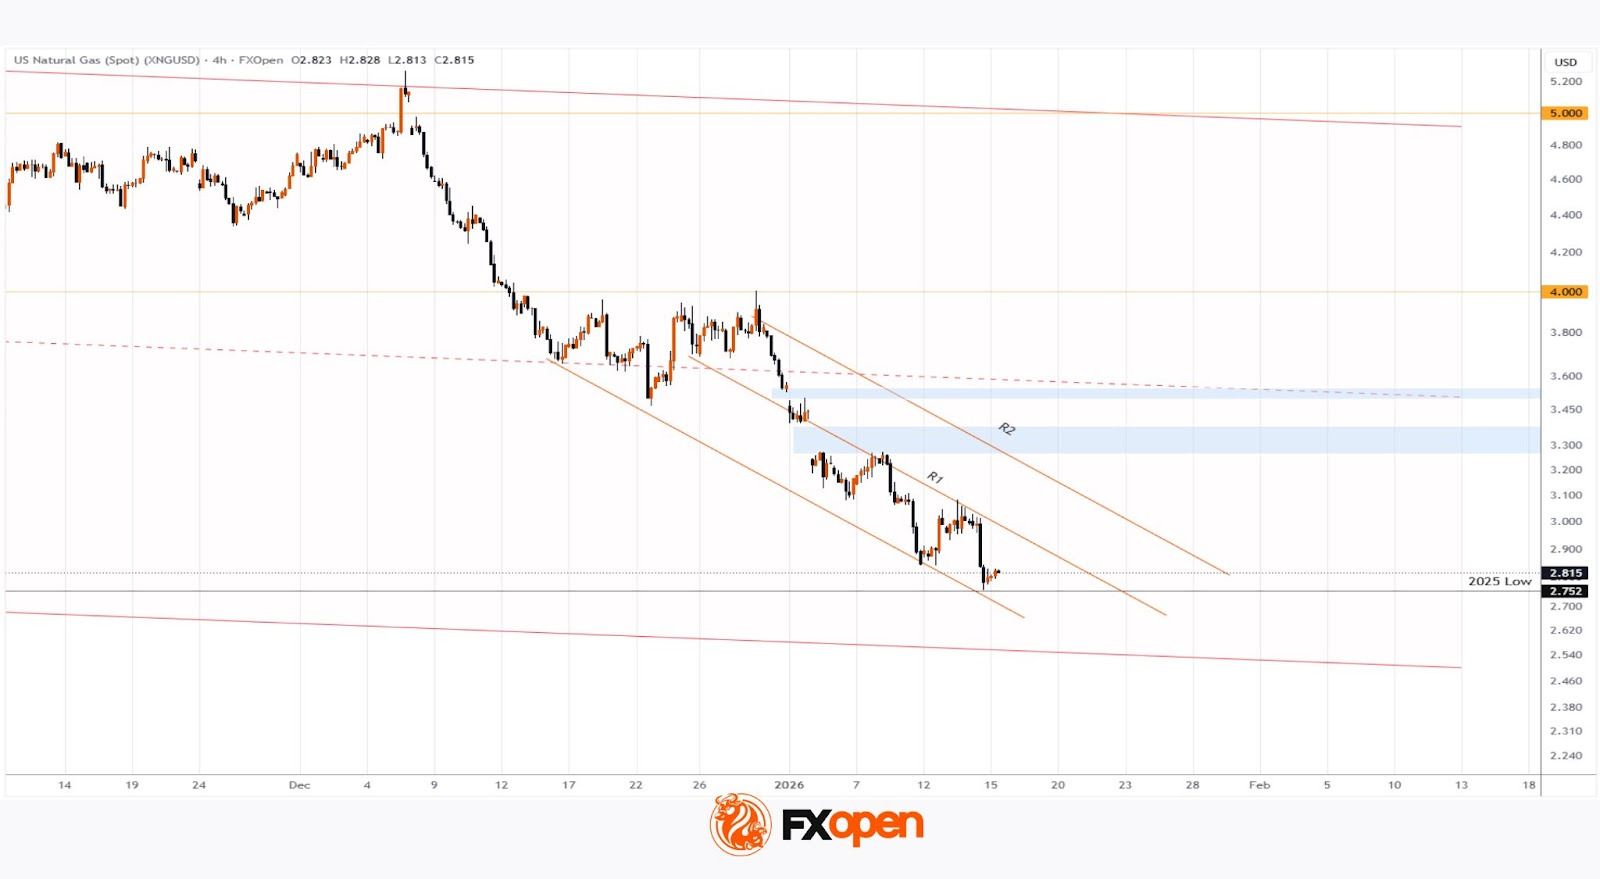
As the XNG/USD chart indicates, natural gas prices are trading very close today to the 2025 low formed in August.
The factors weighing on natural gas prices include:
→ Updated weather models, which are forecasting higher temperatures in the eastern US in late January (24–28), sharply reducing expected demand for gas used for heating.
→ Technical issues with power supply and pipelines at the Cheniere Corpus Christi and Freeport LNG terminals, which have reduced gas flows for export. This means gas that was destined for overseas markets is remaining on the domestic market, adding to inventories.
→ Supply–demand imbalance. US gas production is near record levels (110.7 billion cubic feet per day), while domestic consumption has fallen by 15.5% year-on-year.
Technical Analysis of the XNG/USD Chart
In our earlier analysis of gas prices, we identified a long-term descending channel, shown in red on the chart. On 19 December, we:
→ noted that the price was trading near the channel’s median, where supply and demand typically balance;
→ suggested that the market could enter a consolidation phase.
Indeed, prices hovered around the median until 30–31 December, when a sharp decline began. During this move:
→ bearish gaps formed on the XNG/USD chart, indicating a strong dominance of sellers;
→ based on the price action, a downward trajectory can now be drawn (shown by the orange lines).
Traders should be prepared for the possibility that, in the near term, bears may attempt to break below the 2025 low. In that case, it cannot be ruled out that:
→ this would have a psychological impact on the market;
→ sellers would take profit on short positions;
→ buyers could step in and push gas prices up towards the R2 resistance line.
Start trading commodity CFDs with tight spreads (additional fees may apply). Open your trading account now or learn more about trading commodity CFDs with FXOpen.
This article represents the opinion of the Companies operating under the FXOpen brand only. It is not to be construed as an offer, solicitation, or recommendation with respect to products and services provided by the Companies operating under the FXOpen brand, nor is it to be considered financial advice.
Stay ahead of the market!
Subscribe now to our mailing list and receive the latest market news and insights delivered directly to your inbox.


Latest articles

Gold Price Holds Near Key Support
As the XAU/USD chart shows, the gold price has been holding within the $5,060–$5,200 range over the past several sessions.
Bullish view: the key support is the lower boundary of the long-term channel that has been

EUR/USD Chart Analysis: Pair Rebounds from the Year’s Low
Analysing the EUR/USD chart five days ago, we:
→ constructed a downward channel, noting signs that the bears remained in control;
→ outlined a scenario in which the rate would decline to a new yearly low (and test the lower boundary

Dollar Index (DXY) Hits Yearly High
Today, the dollar index rose above last week’s peak around the 99.68 level, setting a new high for 2026. This movement is supported by a tense fundamental backdrop:
→ Inflationary pressures from rising oil prices. Markets may be pricing