


Natural Gas Prices Fell in Late December
FXOpen

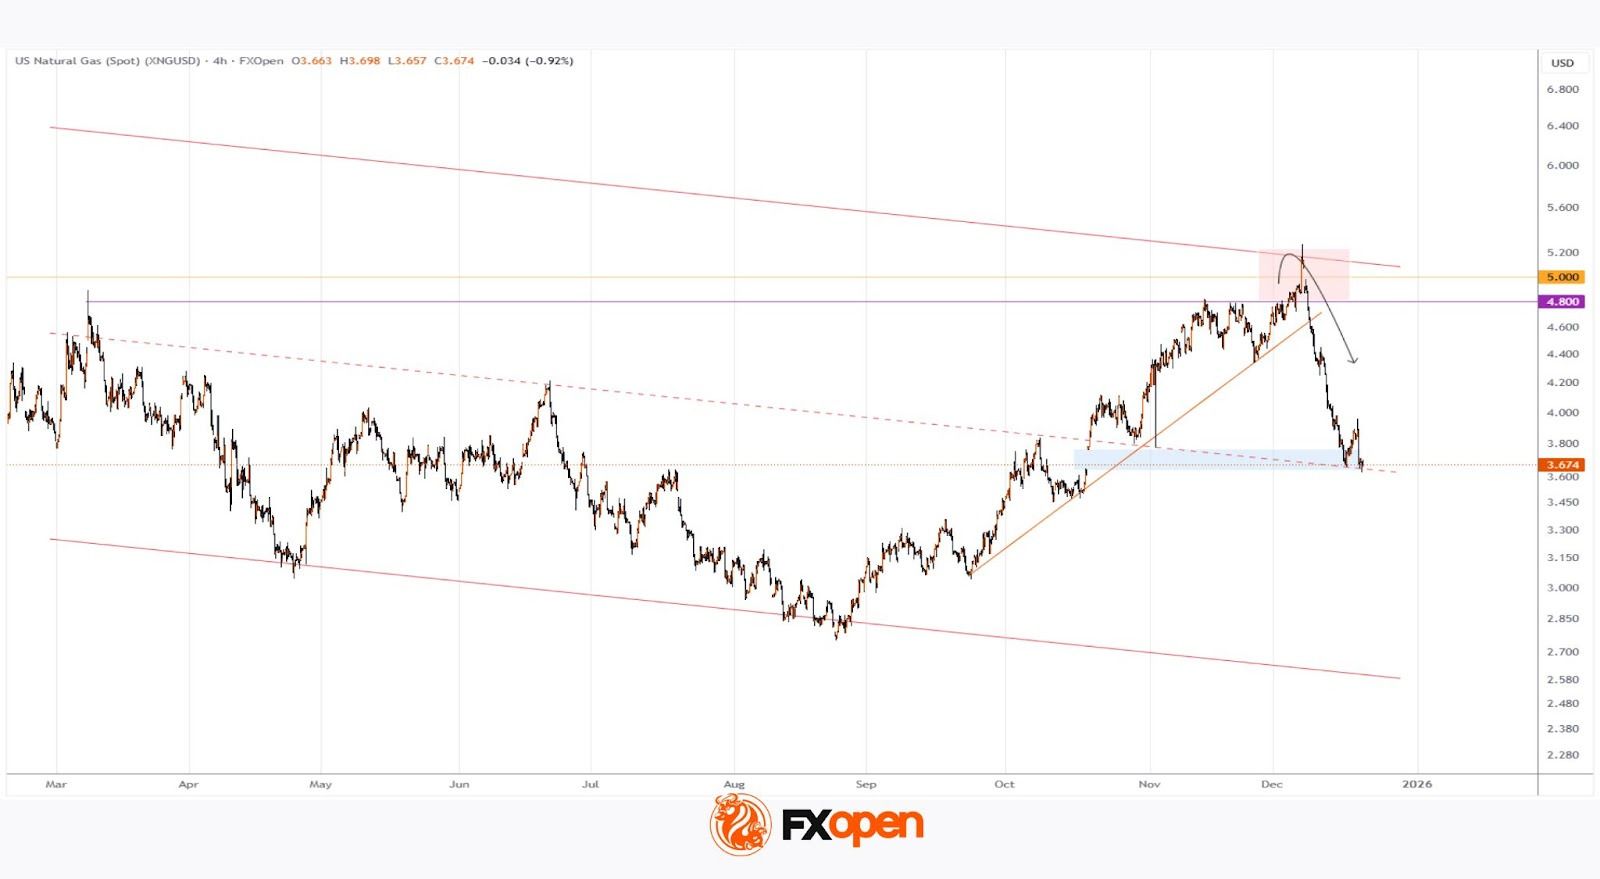
On 4 December, while analysing the XNG/USD chart, we highlighted the rally in natural gas prices towards a three-year high and noted that the price had entered a resistance zone formed by:
→ the upper boundary of a broad descending channel (shown in red);
→ the $4.800/MMBtu level, near which a peak was formed in March;
→ the psychological $5.000/MMBtu mark.
As indicated by the arrow:
→ this resistance cluster proved effective, and after an attempt to break above the $5.000 psychological level, the uptrend reached its climax;
→ following the appearance of a bearish gap on 8 December, selling pressure took control, leading to a break below the orange ascending trend line and a decline in US natural gas prices.
From a fundamental perspective, the pullback has been driven by several factors:
→ Seasonality. Weather forecasts for the US holiday period point to above-average temperatures, reducing demand for heating and power generation.
→ Rising production. According to Trading Economics, natural gas output in the continental United States reached 109.7 billion cubic feet per day in December, maintaining the record levels seen in November. In addition, EIA data show that gas inventories remain 0.9% above the current five-year average.
It is worth noting that today natural gas prices are trading:
→ near a support zone created by the bullish gap formed in the second half of October;
→ close to the median of the aforementioned descending channel, an area where supply and demand often come back into balance.
Taking this into account, it is reasonable to assume that:
→ after a sharp drop of around 30% from the early-December peak, sellers may look to lock in profits ahead of the holidays;
→ the market could enter a consolidation phase.
Start trading commodity CFDs with tight spreads (additional fees may apply). Open your trading account now or learn more about trading commodity CFDs with FXOpen.
This article represents the opinion of the Companies operating under the FXOpen brand only. It is not to be construed as an offer, solicitation, or recommendation with respect to products and services provided by the Companies operating under the FXOpen brand, nor is it to be considered financial advice.
Stay ahead of the market!
Subscribe now to our mailing list and receive the latest market news and insights delivered directly to your inbox.


Latest articles

EUR/USD: All Eyes on the Fed as the Range Reaches Its Breaking Point
The dollar's next move hinges on tonight's Fed decision, and this time markets genuinely don't know what to expect. While economists still lean toward a hold—with CME FedWatch odds sitting near 68.5% for no change—Kevin Warsh's hawkish

USD/JPY and USD/CAD Test Resistance Ahead of Fresh Fed Signals
The US dollar continues to hold the upper hand against most major currencies ahead of the outcome of the latest Federal Reserve meeting. While the base-case scenario remains for interest rates to stay unchanged, markets are also pricing in the

Amazon Earnings: Does the Chart Already Know Something the Numbers Don't?
All eyes are on July 30, when Amazon reports Q2 2026 earnings, with Wall Street increasingly convinced the bar has been set too low. Consensus sees EPS near $1.82-$2.26 on roughly $197 billion in revenue, but the