


Natural Gas Price Nears Three-Year High in Early December
FXOpen

In mid-November, analysing the XNG/USD chart, we noted a rise in natural gas prices, outlined a system of trend channels, and suggested a possible pullback scenario.
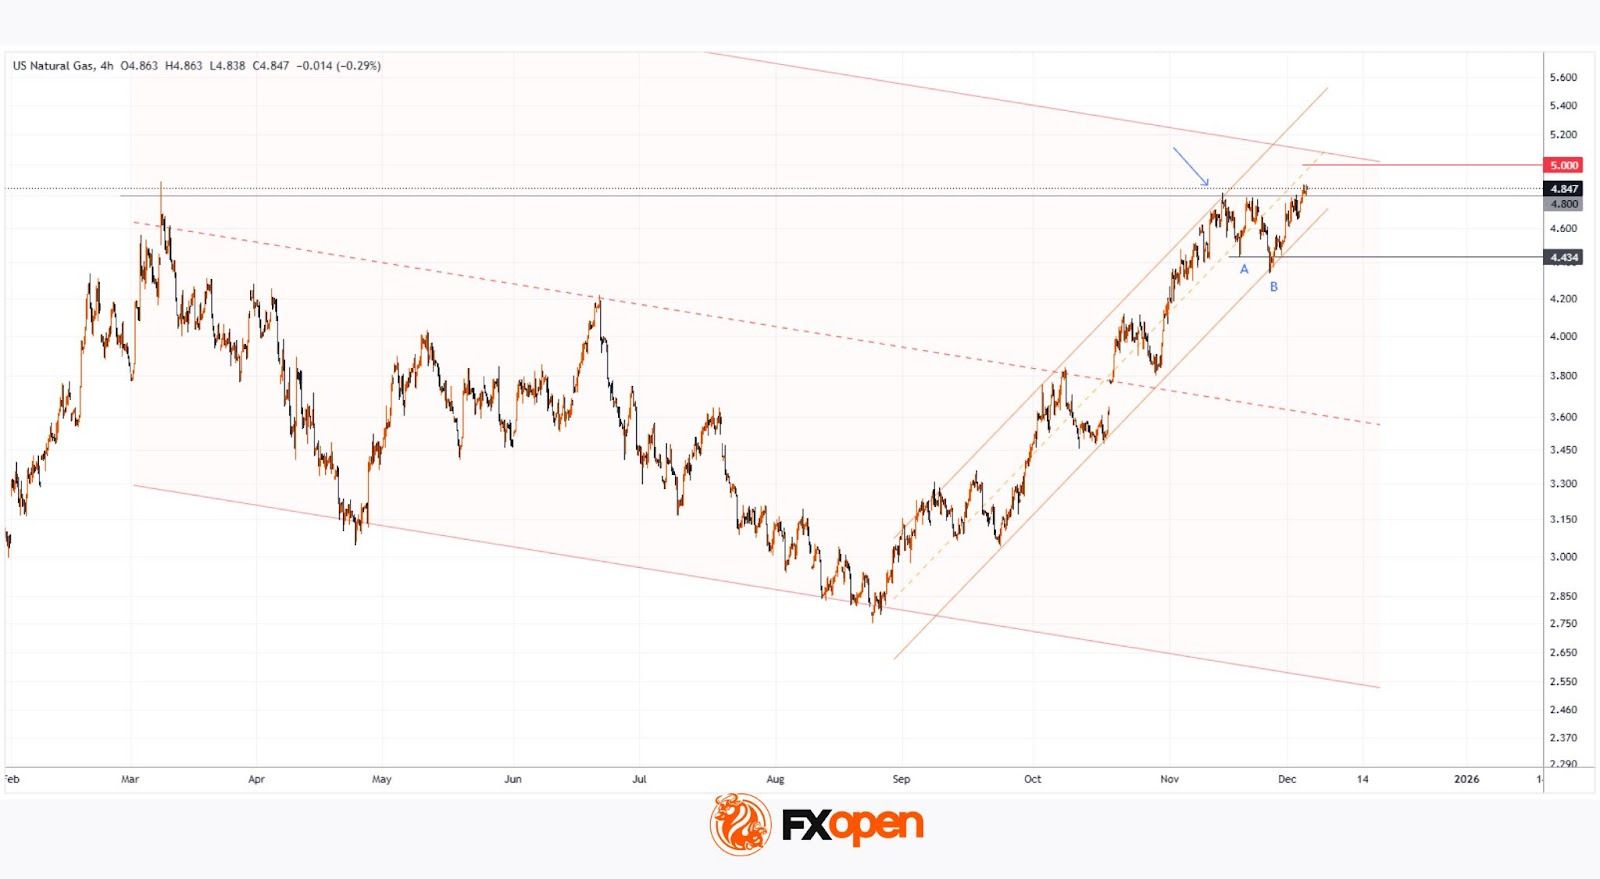
Indeed, since then (as indicated by the arrow), U.S. gas prices retreated to the lower boundary of the orange ascending channel, forming a low at point B. From late November, renewed buying activity has been observed, driven by:
→ Seasonal factor: U.S. forecasts for December indicate below-average temperatures, sharply increasing demand for heating and electricity.
→ Export and geopolitics: The U.S. is exporting record volumes of liquefied natural gas (LNG). Europe continues to purchase U.S. gas to replace Russian supplies, while demand in Asia is also rising.
→ Anticipation of shortages: Due to high exports and early cold weather, traders are factoring in the risk that storage levels may deplete faster than usual.
Technical Analysis of XNG/USD
Price is currently near a resistance zone formed by:
→ The upper boundary of a broad descending channel, extended following a bullish breakout in late October.
→ The $4.800/MMBtu level, near which a peak formed in March.
→ The psychological $5.000/MMBtu mark.
At the same time, price action indicates bulls remain in control:
→ The lower boundary of the orange channel acts as support.
→ Low B resembles a false bearish breakout of low A, trapping short sellers who expected a breakdown.
→ Long lower wicks at low B indicate strong buying pressure.
Given this, it is reasonable to suggest that if U.S. gas prices failed to hold above $4.800/MMBtu in mid-November, December could prove more favourable for bulls, potentially establishing a three-year high.
Start trading commodity CFDs with tight spreads (additional fees may apply). Open your trading account now or learn more about trading commodity CFDs with FXOpen.
This article represents the opinion of the Companies operating under the FXOpen brand only. It is not to be construed as an offer, solicitation, or recommendation with respect to products and services provided by the Companies operating under the FXOpen brand, nor is it to be considered financial advice.
Stay ahead of the market!
Subscribe now to our mailing list and receive the latest market news and insights delivered directly to your inbox.


Latest articles

CAD/JPY: The Yen's Most Historic Move in 30 Years Meets a Fragile Support
Two central banks are heading in genuinely opposite directions this week, and the tension is unmistakable. The Bank of Canada held rates steady at 2.25% on September 2, with a mildly hawkish tilt as policymakers acknowledged a broadening economic

USD/JPY and USD/CAD Await Key Fed Decision
The US dollar is consolidating against the yen and Canadian dollar ahead of the key event of the week — the Federal Reserve meeting. The Fed is widely expected to raise its policy rate by 25 basis points to a range

UnitedHealth: Fundamentals Are Healing, Now the Chart Must Agree
UnitedHealth finds itself in a genuinely split narrative right now, trading near $388, down about 15.9% from its 52-week high, even as the fundamental picture keeps improving. Q2 earnings beat expectations, with revenue of $112.03 billion, and the