


Natural Gas Prices Hover Near a Three-Year High
FXOpen

As the XNG/USD chart shows today, natural gas prices are trading close to the March peak, which is the highest level since December 2022.
According to Trading Economics, the rise in gas prices has been driven by several factors:
→ Despite short-term warming in the US, weather models point to colder conditions ahead.
→ LNG exports remain elevated, as European buyers continue seeking alternatives to Russian gas. In November, average shipments across the eight major US terminals reached 17.8 billion cubic feet per day, exceeding the previous record of 16.7 billion in October.
→ The International Energy Agency expects global demand for oil and gas to continue rising until 2050, reflecting uncertainties surrounding the pace of the energy transition.
At the same time, chart analysis suggests that the upside potential may be limited.
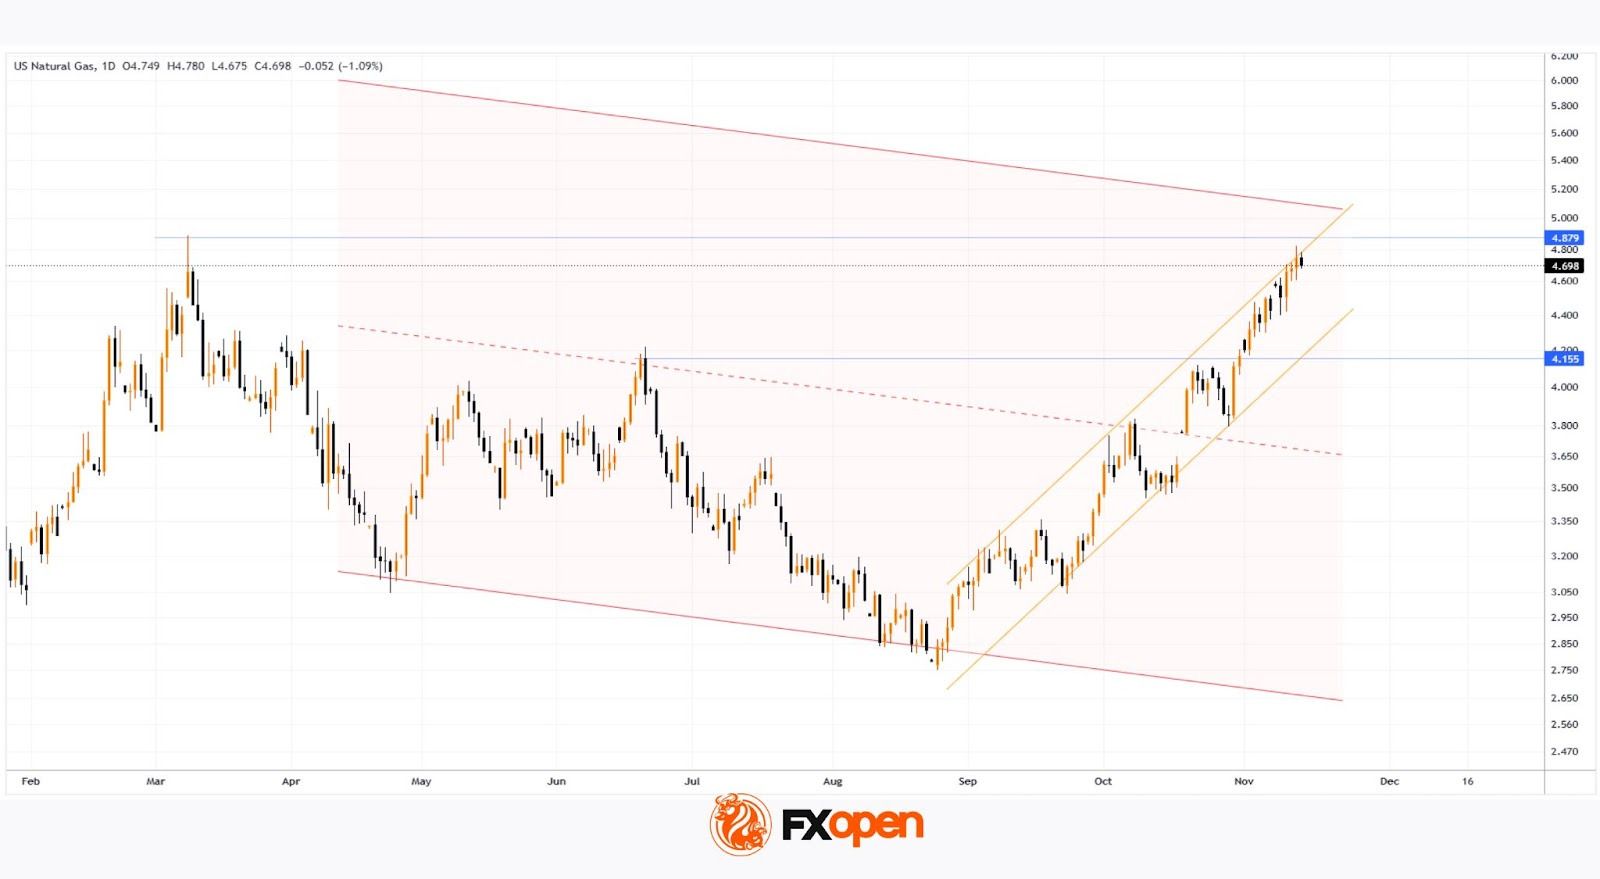
Technical Analysis of XNG/USD
Price action is approaching a major resistance area, formed by:
→ the upper boundary of the channel, widened after the bullish breakout in late October;
→ the psychological level of $5.000 per MMBtu;
→ the previously mentioned March high.
Meanwhile, the more than 50% rally since early autumn has been significant, and long-position holders may be tempted to take profits. Therefore, if the price attempts to break above these resistance levels, it may result in a false bullish breakout (a buyer’s trap) followed by a pullback.
Start trading commodity CFDs with tight spreads (additional fees may apply). Open your trading account now or learn more about trading commodity CFDs with FXOpen.
This article represents the opinion of the Companies operating under the FXOpen brand only. It is not to be construed as an offer, solicitation, or recommendation with respect to products and services provided by the Companies operating under the FXOpen brand, nor is it to be considered financial advice.
Stay ahead of the market!
Subscribe now to our mailing list and receive the latest market news and insights delivered directly to your inbox.


Latest articles

US Dollar Index: A Defining Week for the King of the Markets
The dollar heads into a pivotal week trading near 101.80, just off a 15-month high, with the Fed's July 29 meeting standing as the clear focal point. Markets currently price roughly a 65% chance of a hold, though renewed

NZD/USD: Inflation Surge Meets Strong US Dollar Pressure
On 21 July, Stats NZ reported an acceleration in inflation: the Consumer Price Index rose 1.5% in the second quarter, while the annual inflation rate climbed to 4.1%, its highest level in more than two years and slightly

Weekly Market Insights with Gary Thomson: The Week of Central Banks and Earnings
In this video, we’ll explore the key economic events and market trends, shaping the financial landscape. Get ready for insights into financial markets to help you navigate the week ahead. Let’s dive in!
In this episode of Market