


Natural Gas Prices Rebound from 2.5-Month Low
FXOpen

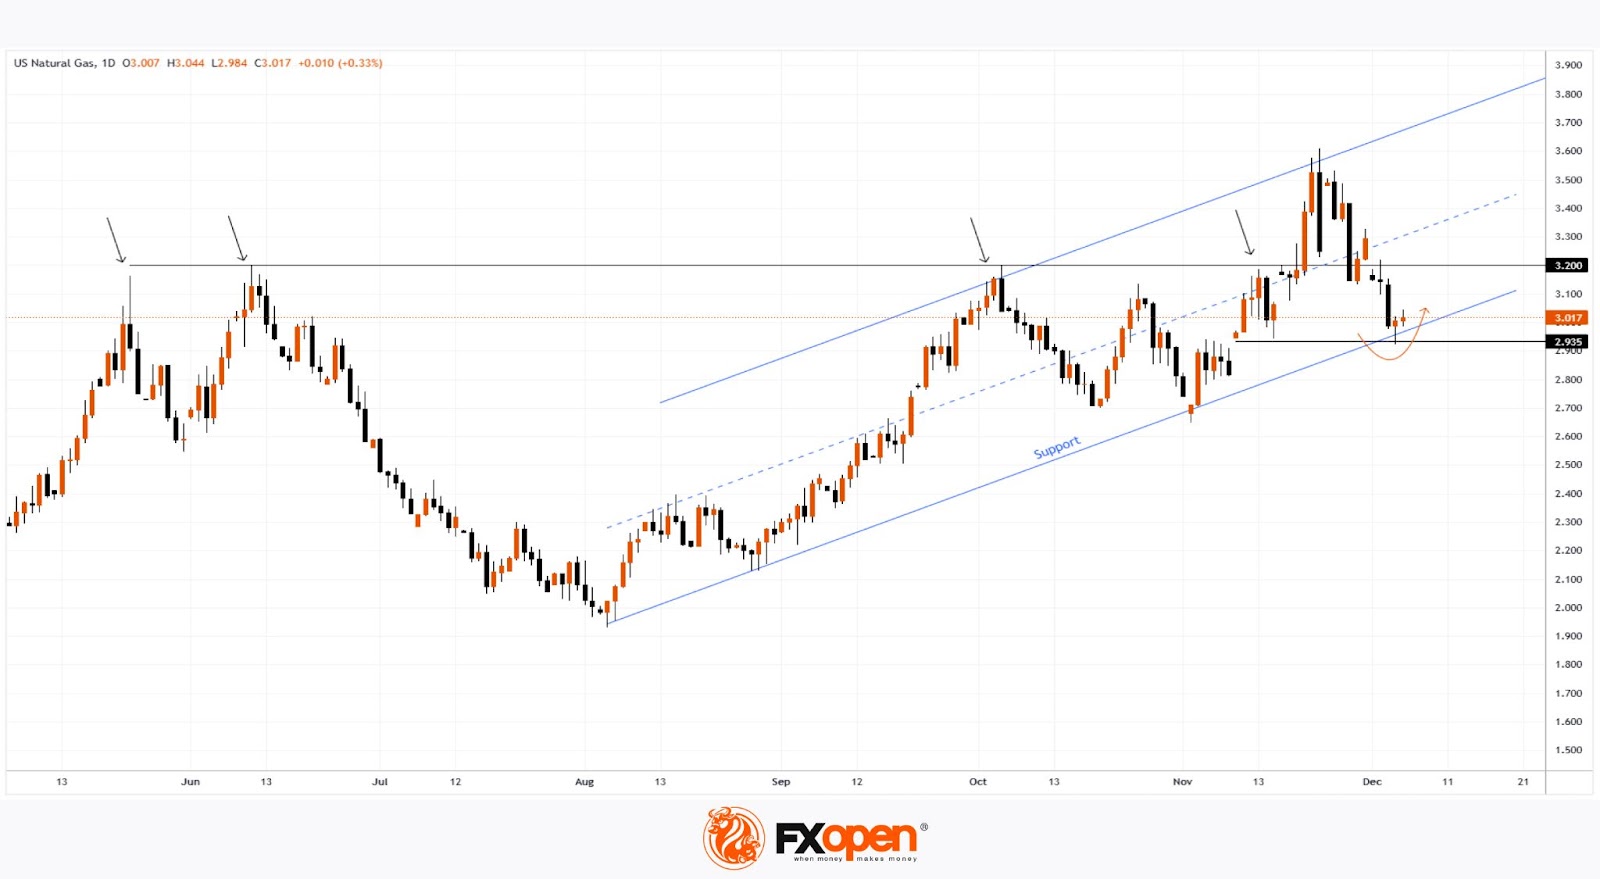
On 19 November, we analysed the natural gas price chart, noting:
→ the formation of an upward channel (marked in blue);
→ a potential bullish attempt to break the key $3.200 level, which had acted as resistance (highlighted with arrows).
As seen on the XNG/USD chart, the price did rise above $3.200 but failed to hold. After fluctuating in the upper half of the channel, it dropped below $3.200 to the channel's lower boundary, driven by:
→ a bearish report from the Energy Information Administration, showing US gas inventories above the five-year average;
→ a report from financial firm LSEG noting increased average gas production across 48 US states.
This decline pushed natural gas prices to a 2.5-month low around the $2.935 level.
What Could Happen Next?
From a technical perspective on the XNG/USD chart:
→ support from the channel's lower boundary (reinforced by the psychological $3.000 mark) is already evident in an emerging price reversal (indicated by an arrow);
→ on the other hand, the $3.200 level may resume acting as resistance.
It’s likely that natural gas prices will fluctuate between $3.000 and $3.200, with weather forecasts playing a decisive role in shaping consumption expectations for the winter season.
Start trading commodity CFDs with tight spreads (additional fees may apply). Open your trading account now or learn more about trading commodity CFDs with FXOpen.
This article represents the opinion of the Companies operating under the FXOpen brand only. It is not to be construed as an offer, solicitation, or recommendation with respect to products and services provided by the Companies operating under the FXOpen brand, nor is it to be considered financial advice.
Stay ahead of the market!
Subscribe now to our mailing list and receive the latest market news and insights delivered directly to your inbox.


Latest articles

AUD/CAD: Months of Indecision — Is a Breakout Finally Coming?
The Australian dollar has clawed back most of its end-of-June losses, when it touched three-month lows against the greenback amid escalating Middle East tensions. Since then, sentiment has improved: the RBA's Assistant Governor Sarah Hunter signalled the board stands ready

USD/JPY: Battling at the Top of the Triangle
On 3 July, Japan's Finance Minister, Satsuki Katayama, stated that the Ministry of Finance remains in close contact with US authorities regarding developments in USD/JPY as the yen traded near its weakest level in almost 40 years. Similar verbal

Dow Jones (DJIA): Consolidation Beyond the Trend
Federal Reserve Chair Kevin Warsh testified before Congress on 14–15 July, reaffirming the Fed's commitment to bringing inflation back to target while providing no clear guidance on the future path of interest rates. Meanwhile, June inflation data came in