


FXOpen
The recent strike by Israel and the US, along with Iran’s retaliatory actions, has pushed energy asset prices higher. Yesterday, we reported on a bullish gap in oil markets, and while US natural gas prices have not surged as sharply, they are also on the rise. Traders’ attention is focused on news from the Strait of Hormuz, through which around 20% of global liquefied gas shipments pass.
Today’s XNG/USD chart reflects the increase in natural gas prices – driven by concerns over potential disruptions to supply chains.
Technical Analysis of XNG/USD
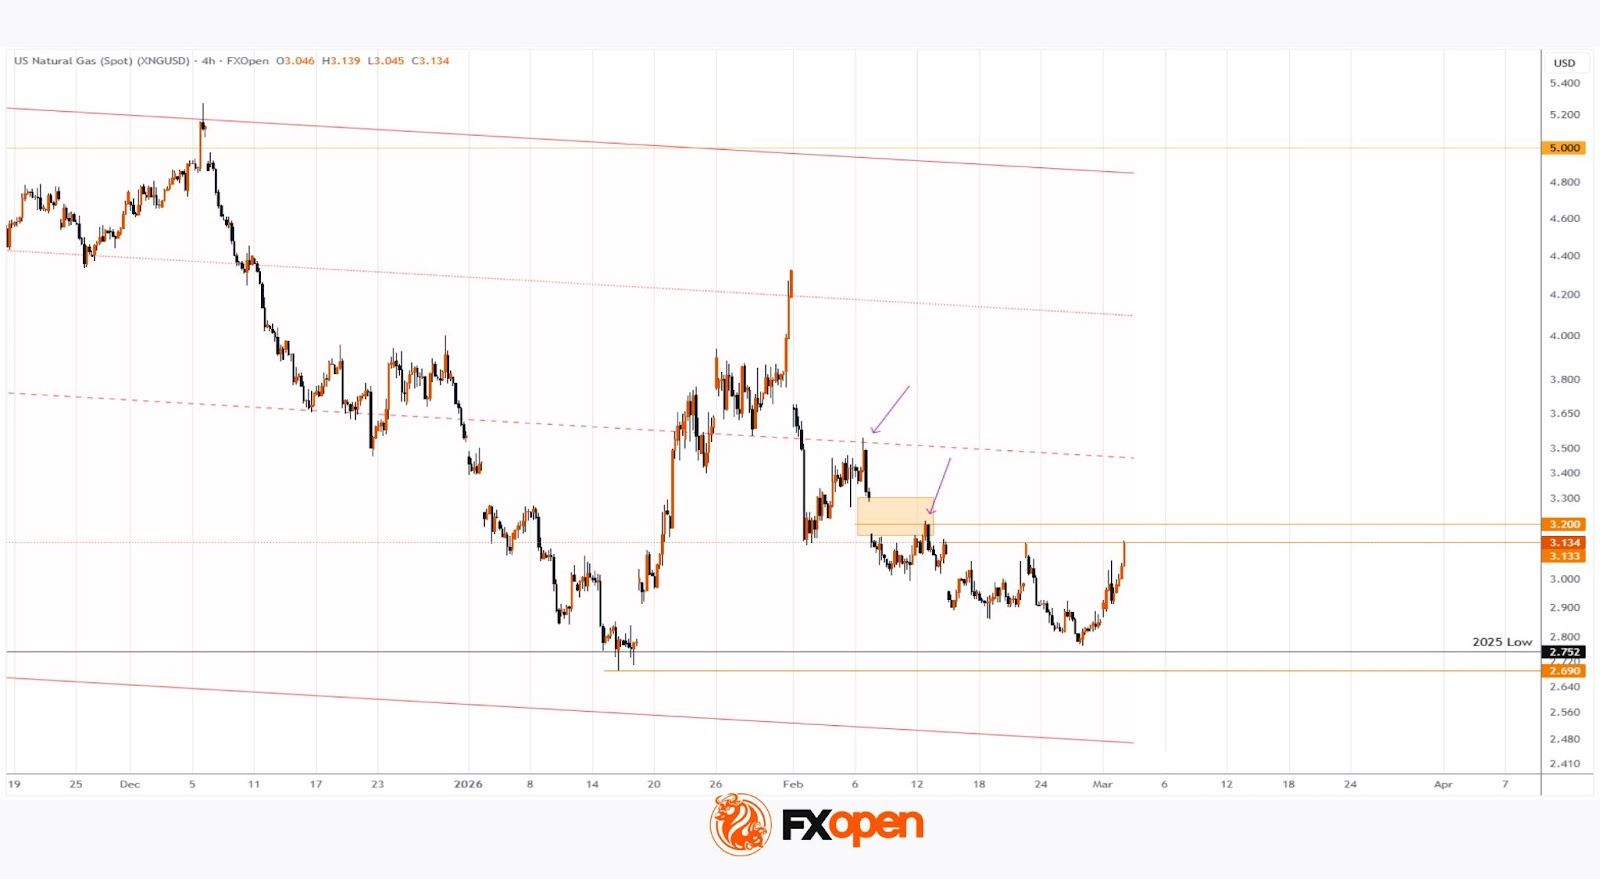
The long-term descending channel, repeatedly referenced in previous analyses, remains relevant – its median acted as resistance on 6 February.
A notable event occurred on 9 February, when a bearish gap formed on the XNG/USD chart (around the 3.200 level). This area acted as resistance on 12 February.
From a bullish perspective:
→ The market finds support near the 2025 low, likely an economically justified support level close to production costs.
→ The reversal on 26 February resembles a Rounding Bottom pattern.
Currently, US natural gas prices are trading near 1.133, where local February highs formed. However, if escalation in the Middle East continues, XNG/USD may rise toward the noted resistance around 3.200.
Start trading commodity CFDs with tight spreads (additional fees may apply). Open your trading account now or learn more about trading commodity CFDs with FXOpen.
This article represents the opinion of the Companies operating under the FXOpen brand only. It is not to be construed as an offer, solicitation, or recommendation with respect to products and services provided by the Companies operating under the FXOpen brand, nor is it to be considered financial advice.
Stay ahead of the market!
Subscribe now to our mailing list and receive the latest market news and insights delivered directly to your inbox.


Latest articles

Tesla (TSLA) Shares Surge Following Musk’s Announcements
According to the chart, Tesla (TSLA) shares had been under significant pressure since the start of 2026: from their December high, they had lost around 25% of their value. The main bearish drivers included:
→ Intense competition from Chinese automakers, particularly

XTI/USD Analysis: WTI Oil Prices Under Pressure from Trump’s Statements
Yesterday, following a false bullish breakout above the psychological $100 level, WTI crude prices fell sharply towards the $85 area. The primary driver of this rapid decline was comments made by the US President.
According to Donald Trump:
→ the United
