


News about US Inflation Shake Markets
FXOpen
According to data published yesterday:
→ Core CPI: actual = 0.4%, expected = 0.3%, past values = 0.3%
→ CPI: actual = 0.3%, expected = 0.2%, past values = 0.3%
Thus, the statistics dealt a blow to the hopes of market participants that inflation in the United States is fading and the Fed will lower interest rates. The figures suggest that tight monetary policy will remain tight for longer.
The market reaction was a sharp rise in the price of the US dollar - accordingly, many exchange assets denominated in USD fell in price:
→ the EUR/USD rate fell by approximately 0.5%, setting a minimum for the year;
→ the price of E-mini futures for the S&P-500 index decreased by approximately 1.5%;
→ the price of E-mini futures for the Nasdaq-100 index decreased by approximately 2.0%;
→ the price of gold XAU/USD decreased by approximately 1.8%;
→ the price of bitcoins BTC/USD decreased by more than 3%, but this morning the cryptocurrencies have already managed to recover, thus winning back yesterday’s dump.
Also resistant to news about inflation in the United States was the price of oil XBR/USD, which is rising against the backdrop of a tense geopolitical situation.
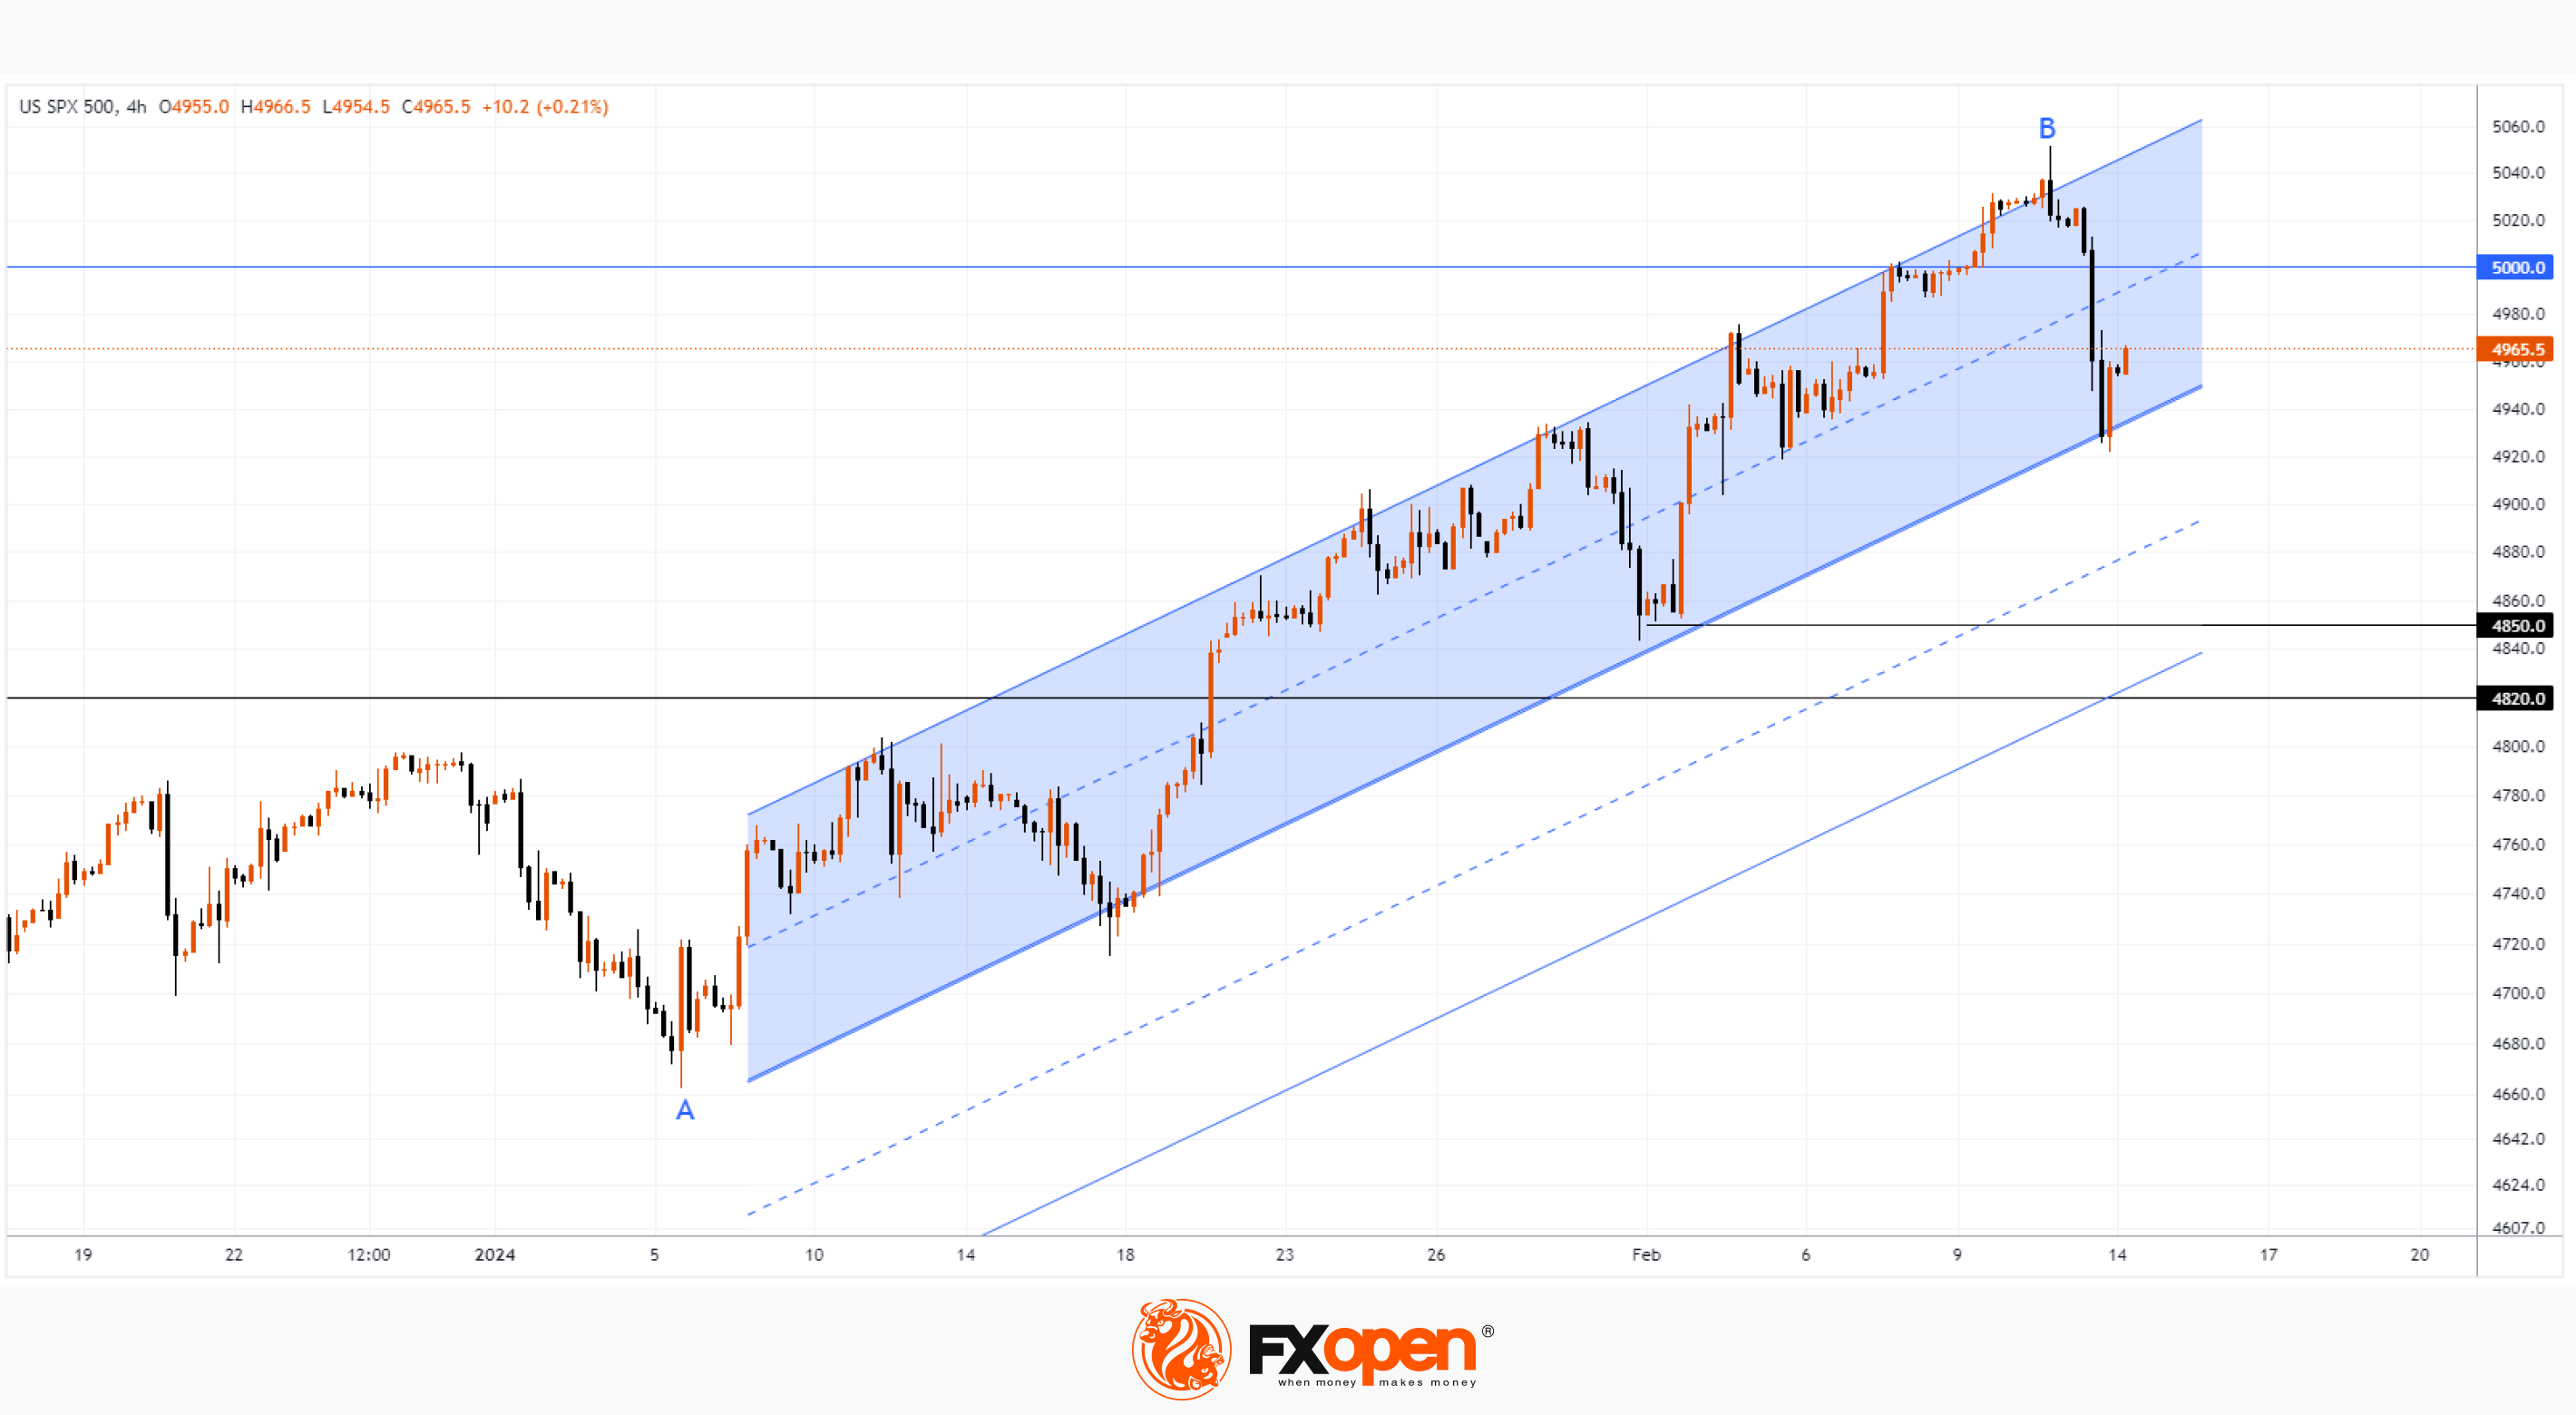
Although stock index charts show that the bullish trend remains in force. But for how long? According to technical analysis of the S&P-500 index chart:
→ the price is within the ascending channel (shown in blue);
→ the price found support near its lower border;
→ the psychological level of 5000 points may turn out to be resistance if the price tries to recover from the lower border of the channel. Note that around the 5000 mark there is a level of 50% of the decrease in B→C.
The S&P-500 index can be supported by:
→ lower boundary of the parallel channel;
→ level 4820, which previously served as resistance, but was powerfully broken by the bulls on January 19;
→ level 4850, which approximately coincides with the level of the 50% retracement of the A→B impulse.
Trade global index CFDs with zero commission and tight spreads (additional fees may apply). Open your FXOpen account now or learn more about trading index CFDs with FXOpen.
This article represents the opinion of the Companies operating under the FXOpen brand only. It is not to be construed as an offer, solicitation, or recommendation with respect to products and services provided by the Companies operating under the FXOpen brand, nor is it to be considered financial advice.
Stay ahead of the market!
Subscribe now to our mailing list and receive the latest market news and insights delivered directly to your inbox.


Latest articles

Weekly Market Insights with Gary Thomson: The Week of Central Banks and Earnings
In this video, we’ll explore the key economic events and market trends, shaping the financial landscape. Get ready for insights into financial markets to help you navigate the week ahead. Let’s dive in!
In this episode of Market

Intel at a Crossroads: Earnings Beat Meets Technical Resistance
Intel has just delivered its strongest quarter in over fifteen years, and the market reaction says it all. Q2 2026 revenue surged 25% year-over-year to $16.1 billion, crushing the consensus estimate of $14.42 billion, while adjusted EPS of

Tesla: Complex Range Structure Breaks Down Following Quarterly Earnings
Tesla released its Q2 2026 results after the market closed on 22 July. Revenue increased 26% year-on-year to $28.24 billion, while vehicle deliveries reached a record 480,126 units. However, operating margin fell sharply to 1.4%, down from