


NIKKEI-225 Analysis Indicates Possibility of Correction from Historically High Levels
FXOpen

On March 21, the value of the Japanese stock index reached a historical maximum, exceeding the level of 41,100 points. This was facilitated by:
→ Weak yen supporting exporters. It increases the value of profits earned abroad for a large number of companies that sell their products abroad and then convert the profits into yen.
→ Demand for shares of Japanese companies paying dividends. For example, shares of air conditioner manufacturer Daikin Industries rose by 2.82%.
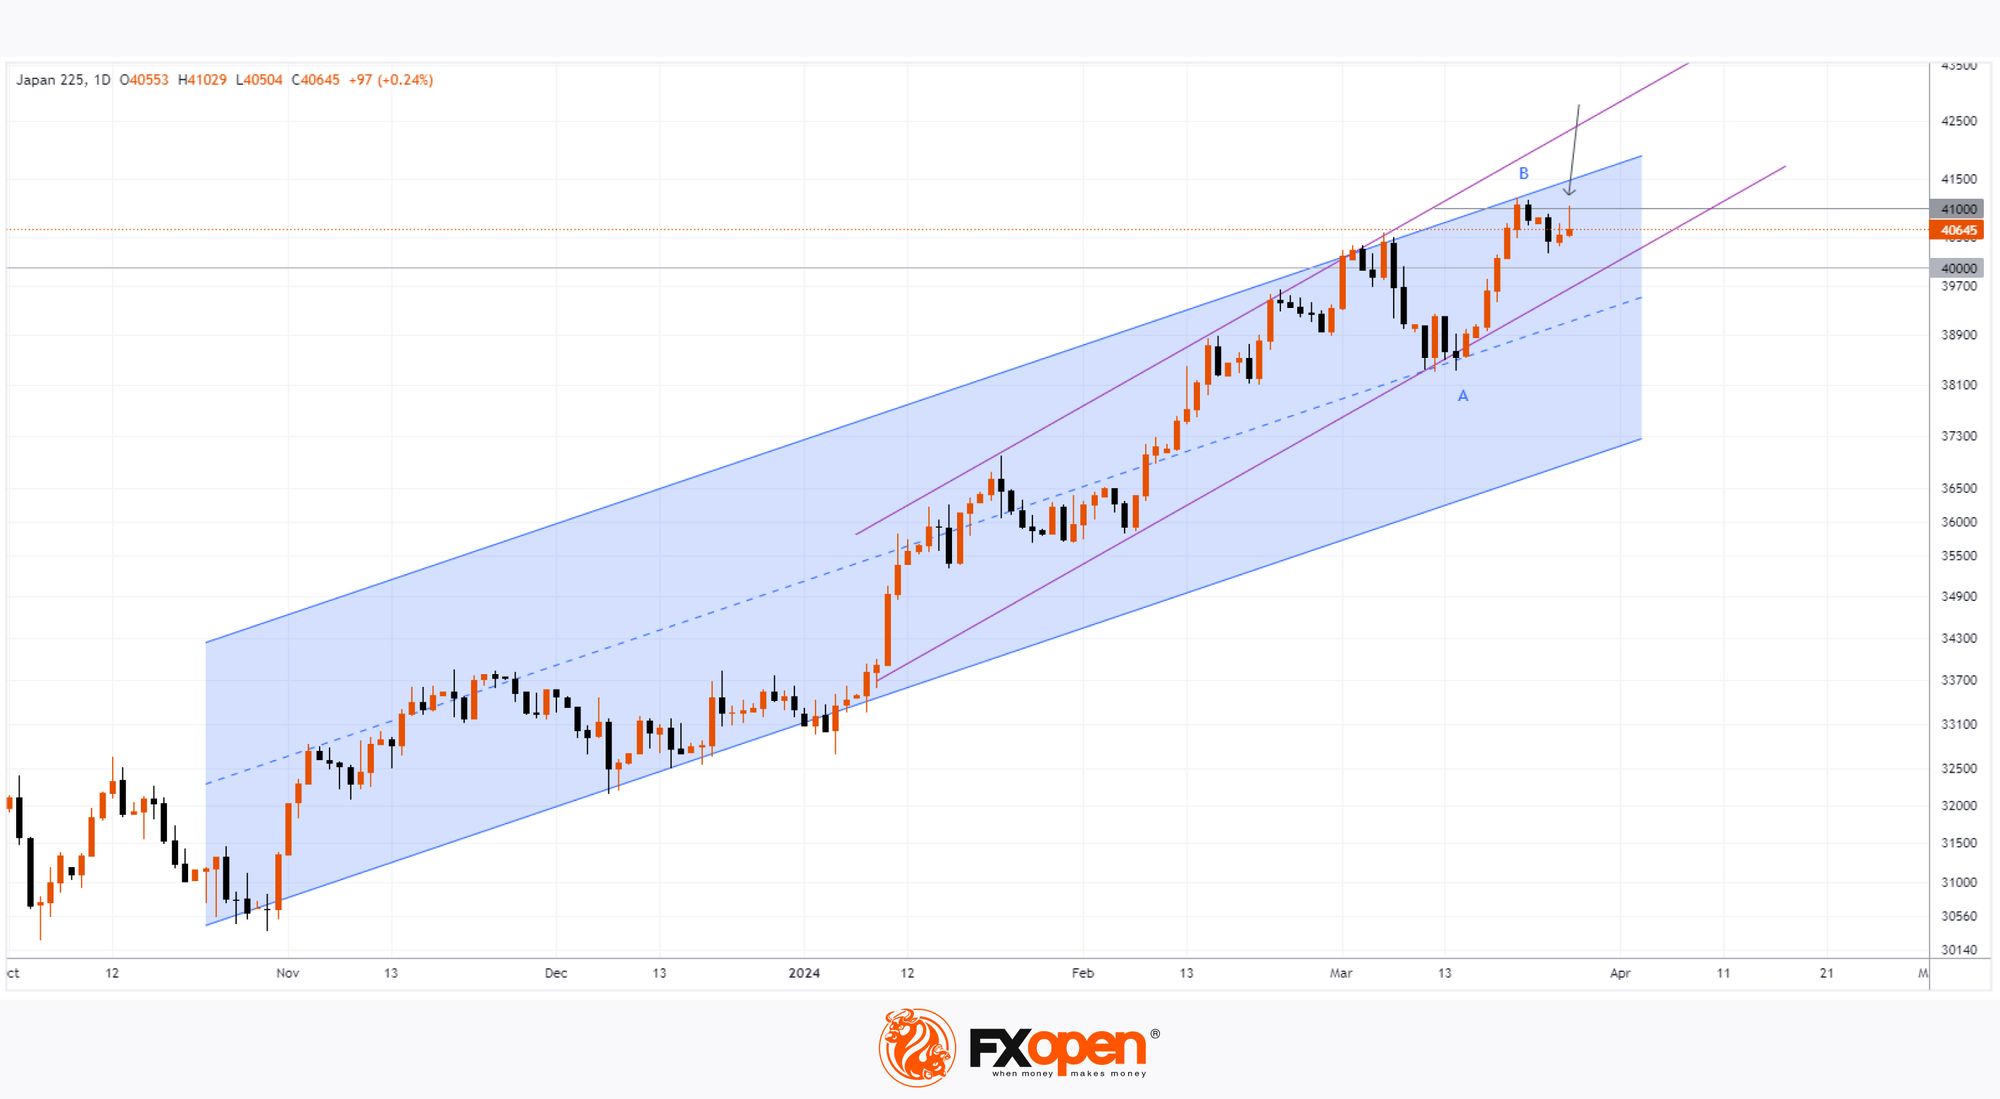
At the same time, the NIKKEI-225 chart signals indicate the likelihood of a correction, since:
→ The price is near the upper border of the ascending channel, from which resistance can be expected.
→ Based on the results of trading in the Asian session, a long upper shadow is forming on today’s candle – a sign of selling pressure (as shown by the arrow). It seems that the price of NIKKEI-225 is difficult to stay above the level of 41,000.
If the Japanese stock market follows a correction scenario, the price of NIKKEI-225 may be supported by:
→ the lower boundary of a steeper ascending channel (shown in purple), which runs in the area of the Fibonacci level = 50% of the A→B impulse;
→ psychological level of 40,000.
Bearish sentiment for NIKKEI-225 could be triggered by decisions from the Bank of Japan and the Ministry of Finance, which are concerned about the weakness of the yen — the USD/JPY rate is today near a 34-year low.
Trade global index CFDs with zero commission and tight spreads (additional fees may apply). Open your FXOpen account now or learn more about trading index CFDs with FXOpen.
This article represents the opinion of the Companies operating under the FXOpen brand only. It is not to be construed as an offer, solicitation, or recommendation with respect to products and services provided by the Companies operating under the FXOpen brand, nor is it to be considered financial advice.
Stay ahead of the market!
Subscribe now to our mailing list and receive the latest market news and insights delivered directly to your inbox.


Latest articles

Amazon Earnings: Does the Chart Already Know Something the Numbers Don't?
All eyes are on July 30, when Amazon reports Q2 2026 earnings, with Wall Street increasingly convinced the bar has been set too low. Consensus sees EPS near $1.82-$2.26 on roughly $197 billion in revenue, but the

WTI Analysis: Gap Breaks Short-Term Trend as Price Remains Trapped Between the POC and Profile Boundary
WTI crude oil plunged by more than 7% on 27 July 2026 after the US suspended a series of strikes against Iran over the weekend, raising hopes of a diplomatic solution and the reopening of shipping through the Strait of

US Dollar Index: A Defining Week for the King of the Markets
The dollar heads into a pivotal week trading near 101.80, just off a 15-month high, with the Fed's July 29 meeting standing as the clear focal point. Markets currently price roughly a 65% chance of a hold, though renewed