


NIKKEI Analysis: High of 33 Years
FXOpen
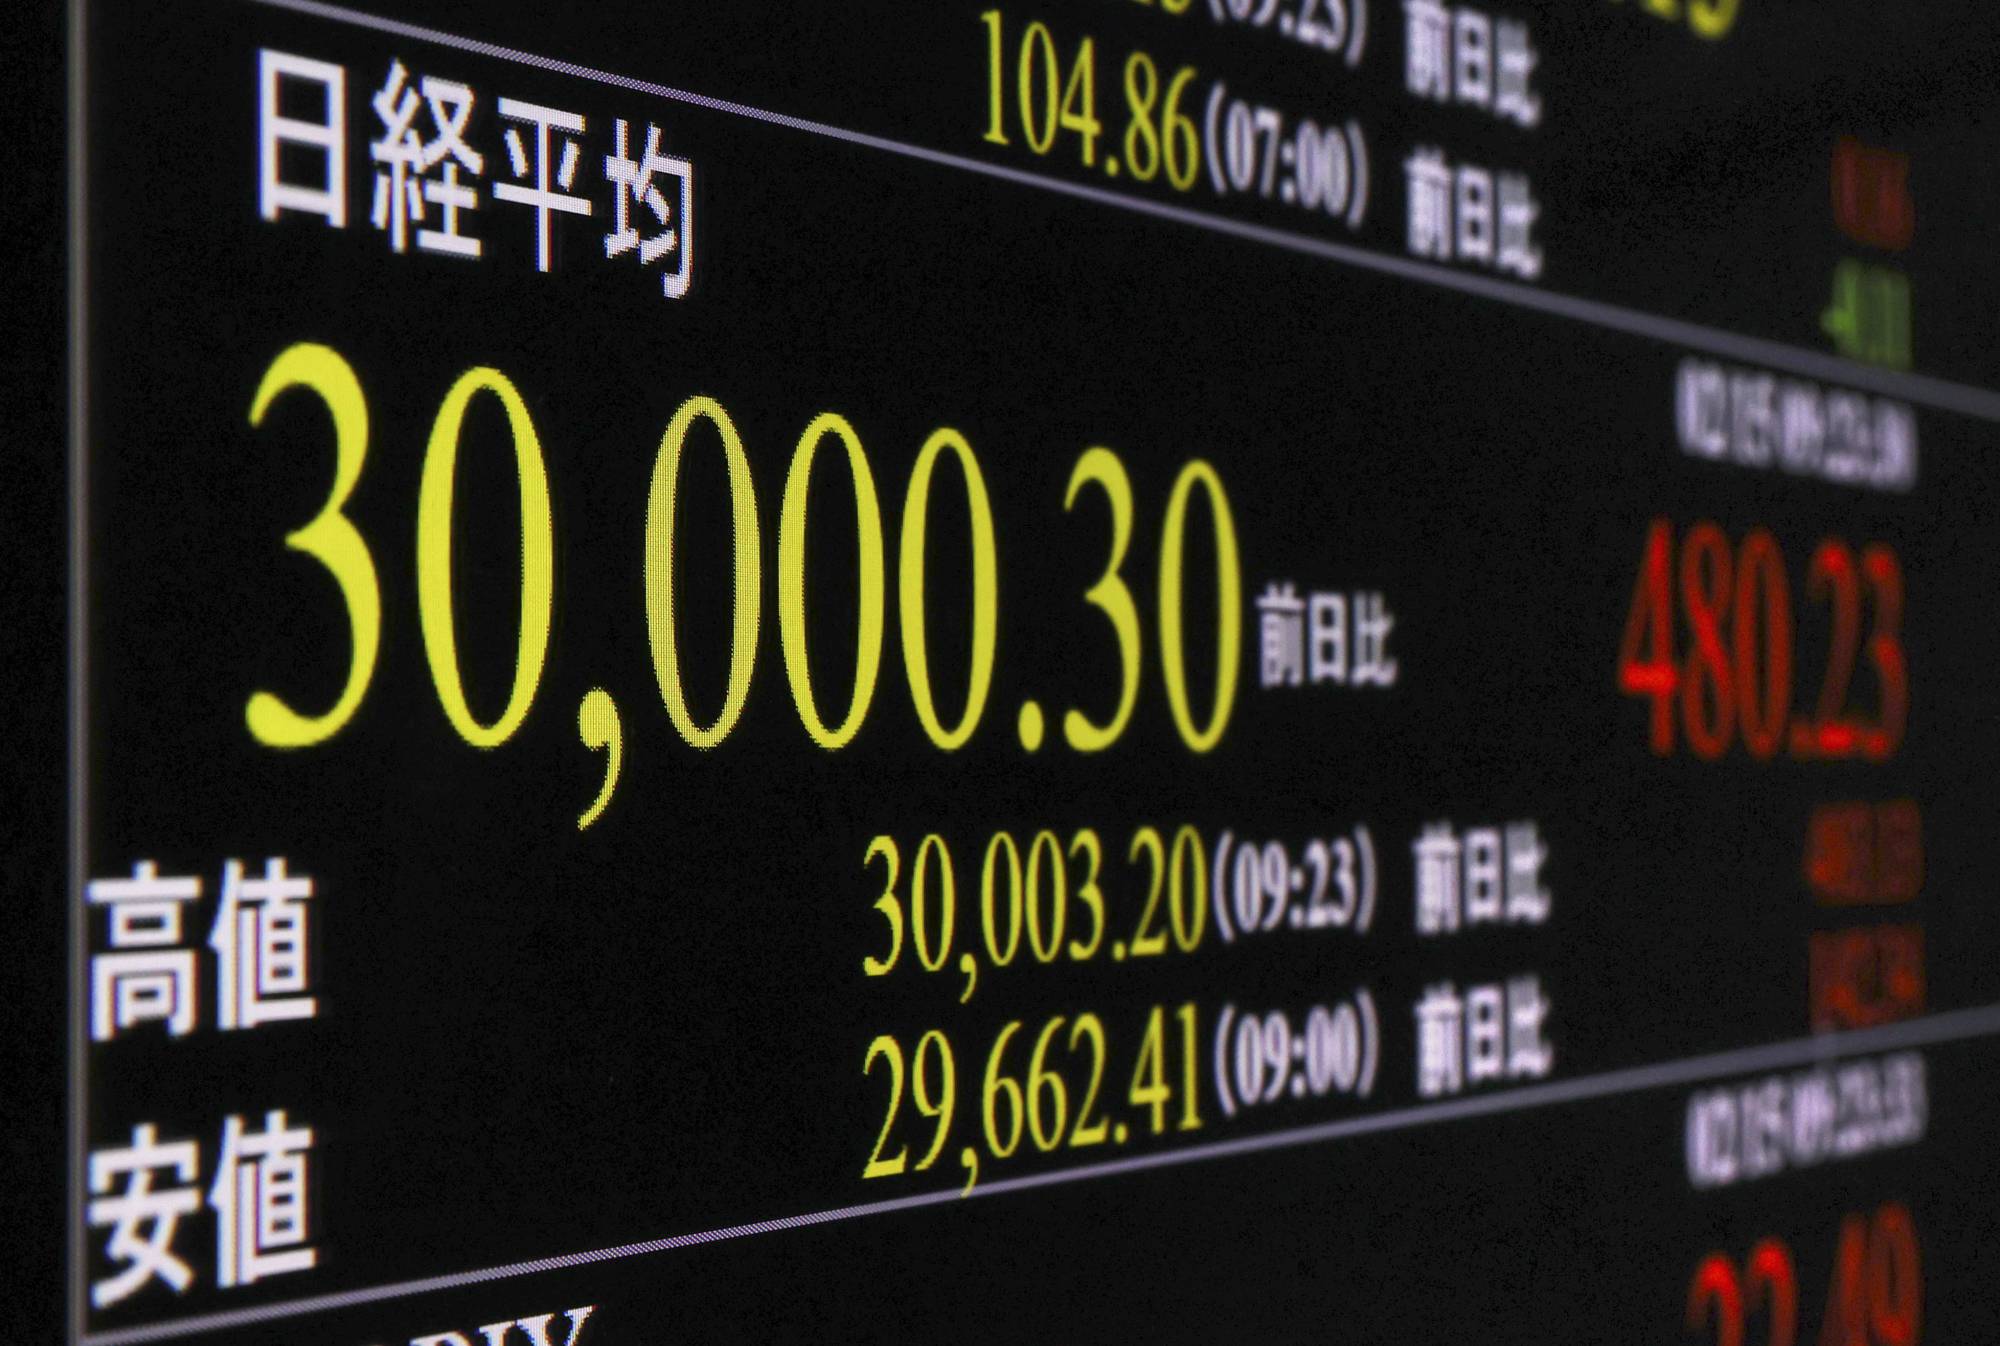
The Japanese stock market index, made up of shares of 225 companies, is showing high volatility today, attempting to break through the September high. Reuters wrote that the index had reached its highest level since 1990. The record is due to low rates from the Bank of Japan, which are helping the country's export-oriented industry (in particular, the automobile industry) and financial sector to grow.
At the same time, in various financial markets, Nikkei-related instruments may not have recorded a maximum in 33 years — the reason is liquidity and what appears to be the top of the market:
→ there was a massive liquidation of short positions;
→ major market participants recorded profits.
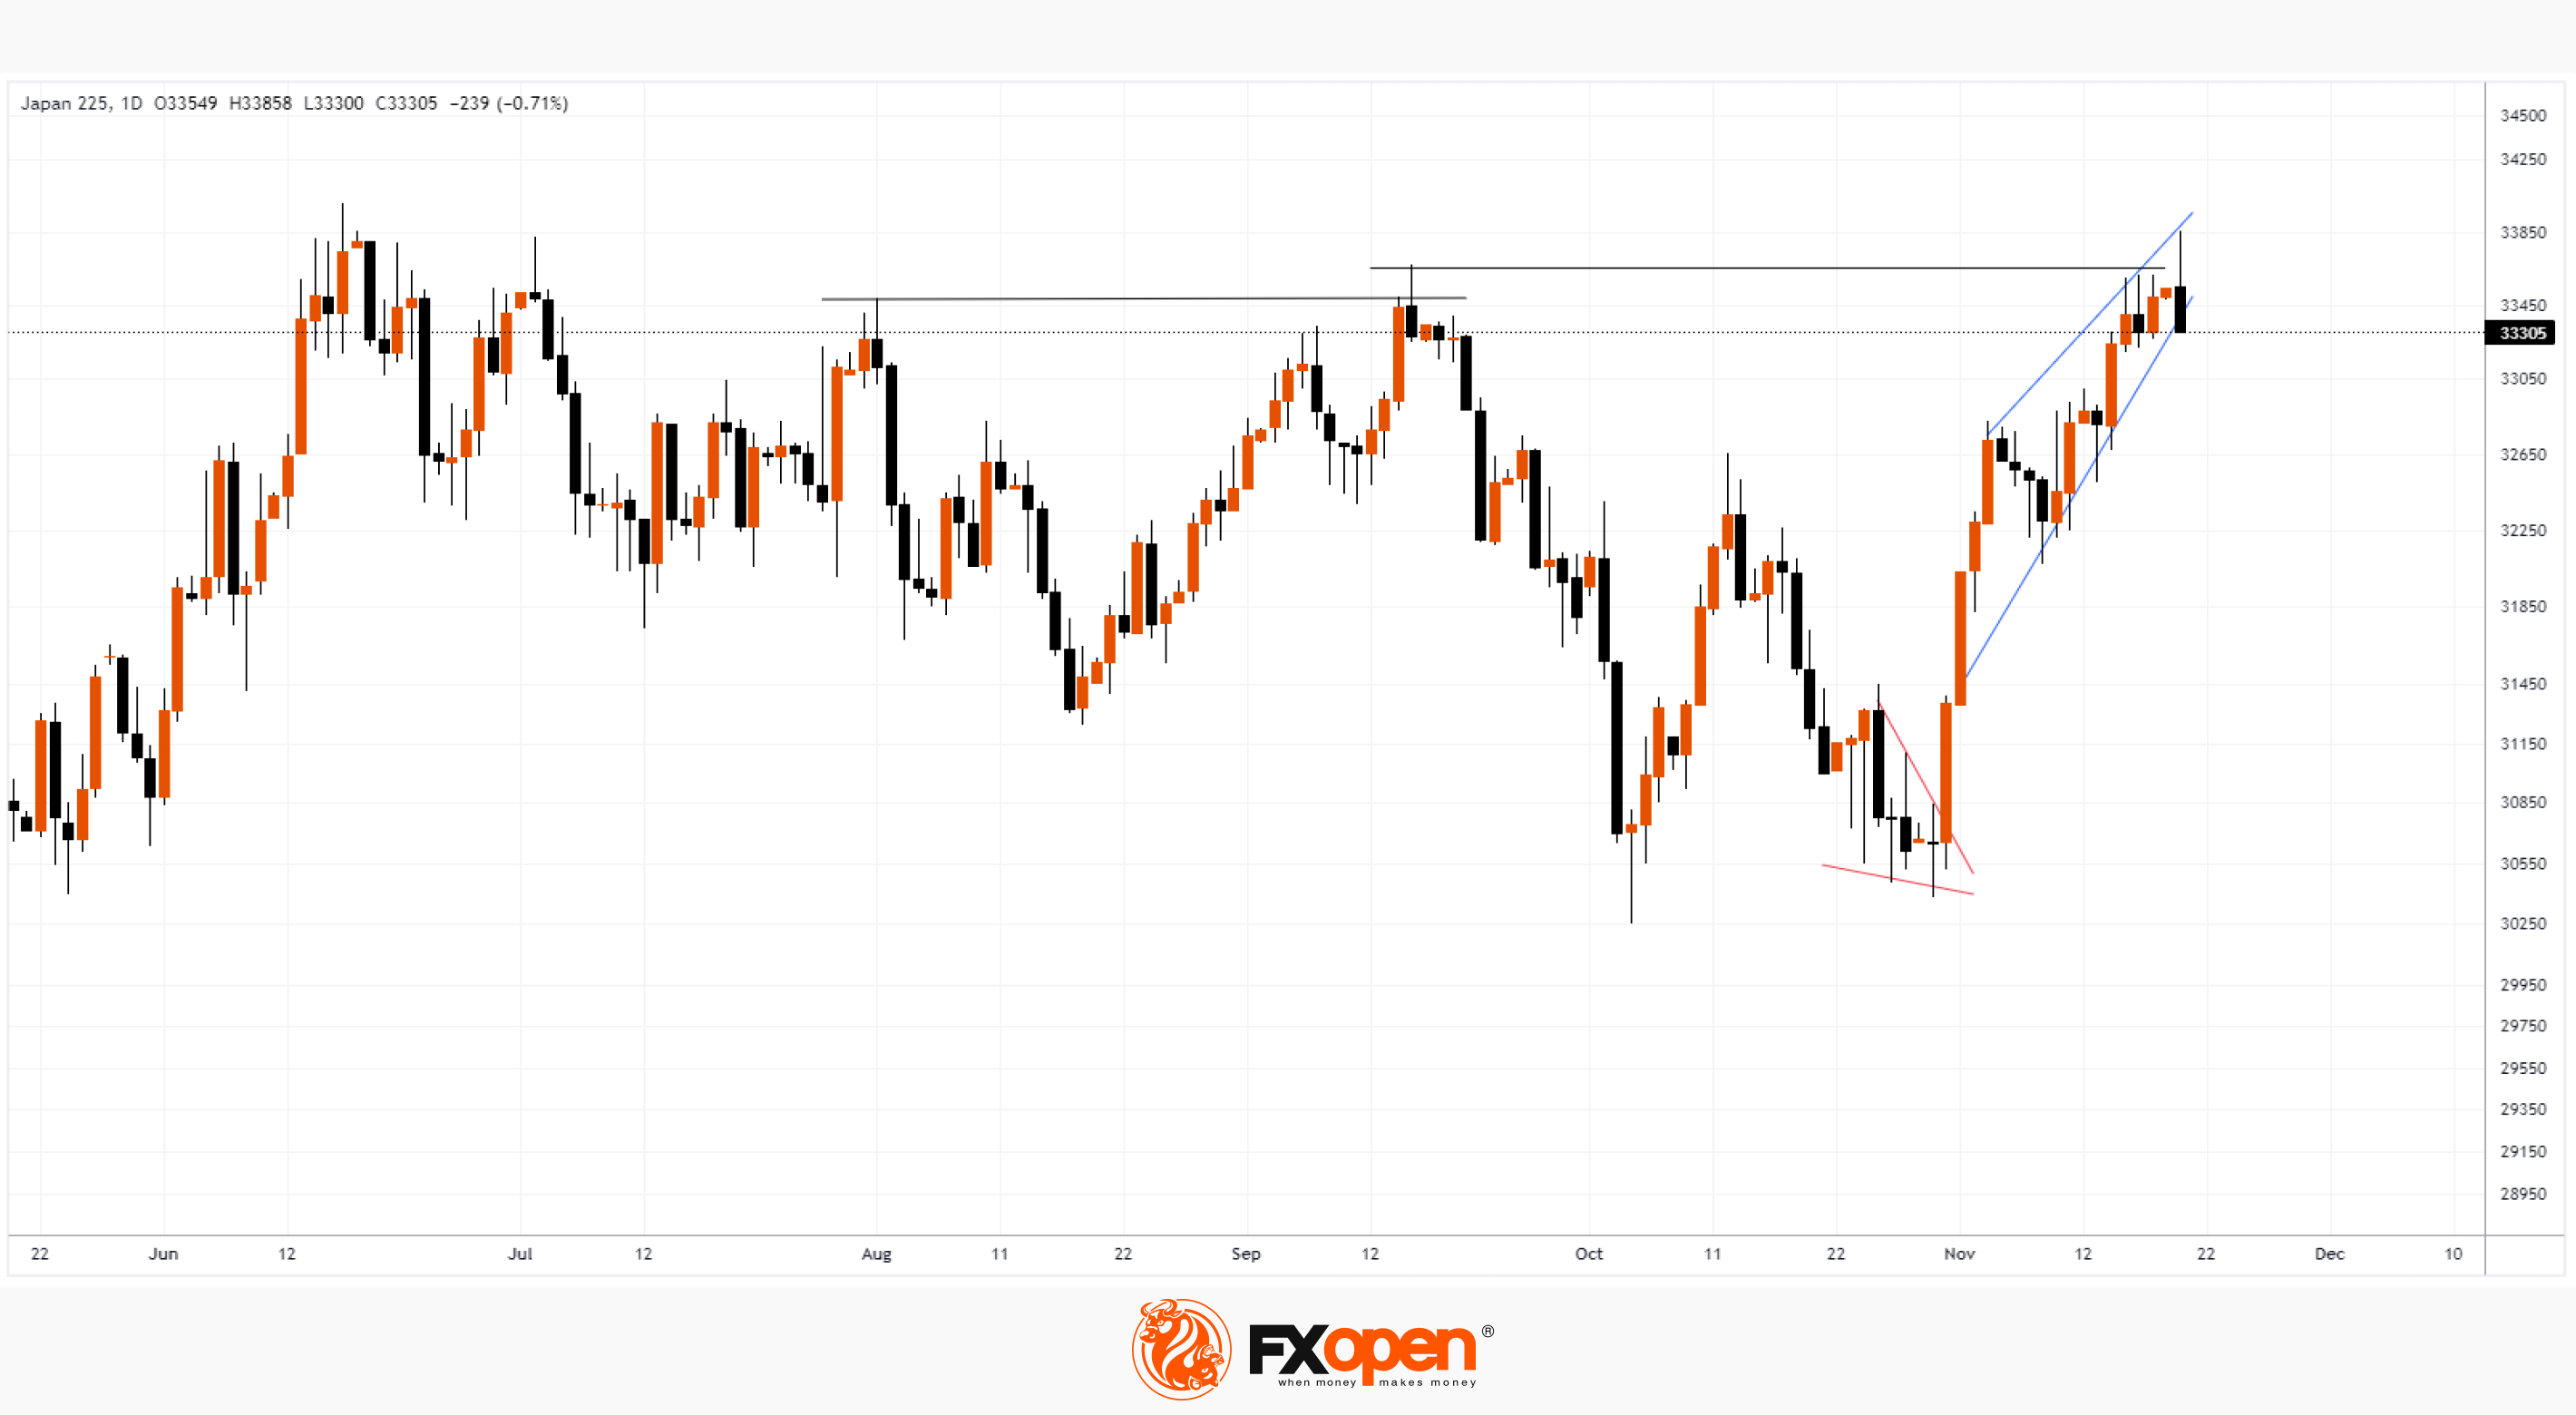
Therefore, the daily candlestick on European Monday morning has a long upper shadow. Note that today's high could be a false breakout of the September top, which in turn is a false breakout of the August top.
The chart shows that the price of NIKKEI is forming a tapering wedge pattern (shown with blue lines) pointing upward. A bearish breakout of this pattern could lead to the development of a downtrend.
Something similar (but in a mirror image) was recorded at the end of October, when a downward wedge formed on the chart (shown by red lines, more clearly visible on the 4-hour chart). The breakout of this wedge led to a rally of over 9%.
If the NIKKEI enters a downtrend, it could be fueled by rumors of an end to the low rate policy. Experts in the media are increasingly predicting this move by the Bank of Japan.
Trade global index CFDs with zero commission and tight spreads (additional fees may apply). Open your FXOpen account now or learn more about trading index CFDs with FXOpen.
This article represents the opinion of the Companies operating under the FXOpen brand only. It is not to be construed as an offer, solicitation, or recommendation with respect to products and services provided by the Companies operating under the FXOpen brand, nor is it to be considered financial advice.
Stay ahead of the market!
Subscribe now to our mailing list and receive the latest market news and insights delivered directly to your inbox.


Latest articles

Dow Jones (DJIA): Consolidation Beyond the Trend
Federal Reserve Chair Kevin Warsh testified before Congress on 14–15 July, reaffirming the Fed's commitment to bringing inflation back to target while providing no clear guidance on the future path of interest rates. Meanwhile, June inflation data came in

European Currencies Strengthen Ahead of Key Macroeconomic Releases
EUR/USD and GBP/USD continue to recover moderately following the recent weakening of the US dollar. European currencies have been supported by expectations that US inflationary pressures will continue to ease after softer-than-expected CPI and PPI data, reinforcing market

Brent Crude Oil: From Ceasefire to Crossfire — What's Next?
Just weeks ago, traders were pricing in peace. Now they're pricing in war again—and that reversal says everything about how fragile the current Middle East calm really is.
Brent crude has surged to $86 a barrel, its highest level