


NIKKEI Analysis: Japanese Stock Market Outlook
FXOpen

In the first half of 2023, the Japanese stock market was dominated by bullish sentiment due to (still) negative interest rates — while the rest of the G7 countries raised their rates to combat inflation.
The NIKKEI-225 index grew by 30% in the first half of the year. But then the balance of supply and demand was achieved, judging by the daily chart, where a range was formed (shown in blue), framing the index’s fluctuations in the second half of the year. Judging by the change in the slope of the bullish trend lines, demand was sufficient to maintain the price at the lower limit of the range, but not enough to go beyond the upper limit.
The situation is fundamentally reversed. While interest rates in the US, Europe and elsewhere are thought to be near the top, there is growing talk in Japan that the central bank will begin raising them after years of being stuck in negative territory:
→ Bloomberg: The next meeting of the Bank of Japan will be held on December 19 – speculation is growing that the Bank will move away from negative interest rates as early as this month.
→ Reuters: 22 of 26 economists (85%) surveyed in November believe the Bank of Japan will abandon its negative interest rate policy by the end of next year.
The winding down of ultra-loose monetary policy could have a negative impact on the growth of Japanese companies - accordingly, the growing bearish sentiment is reflected in the index quote. Since the end of November, the NIKKEI 225 has dropped almost 5%.
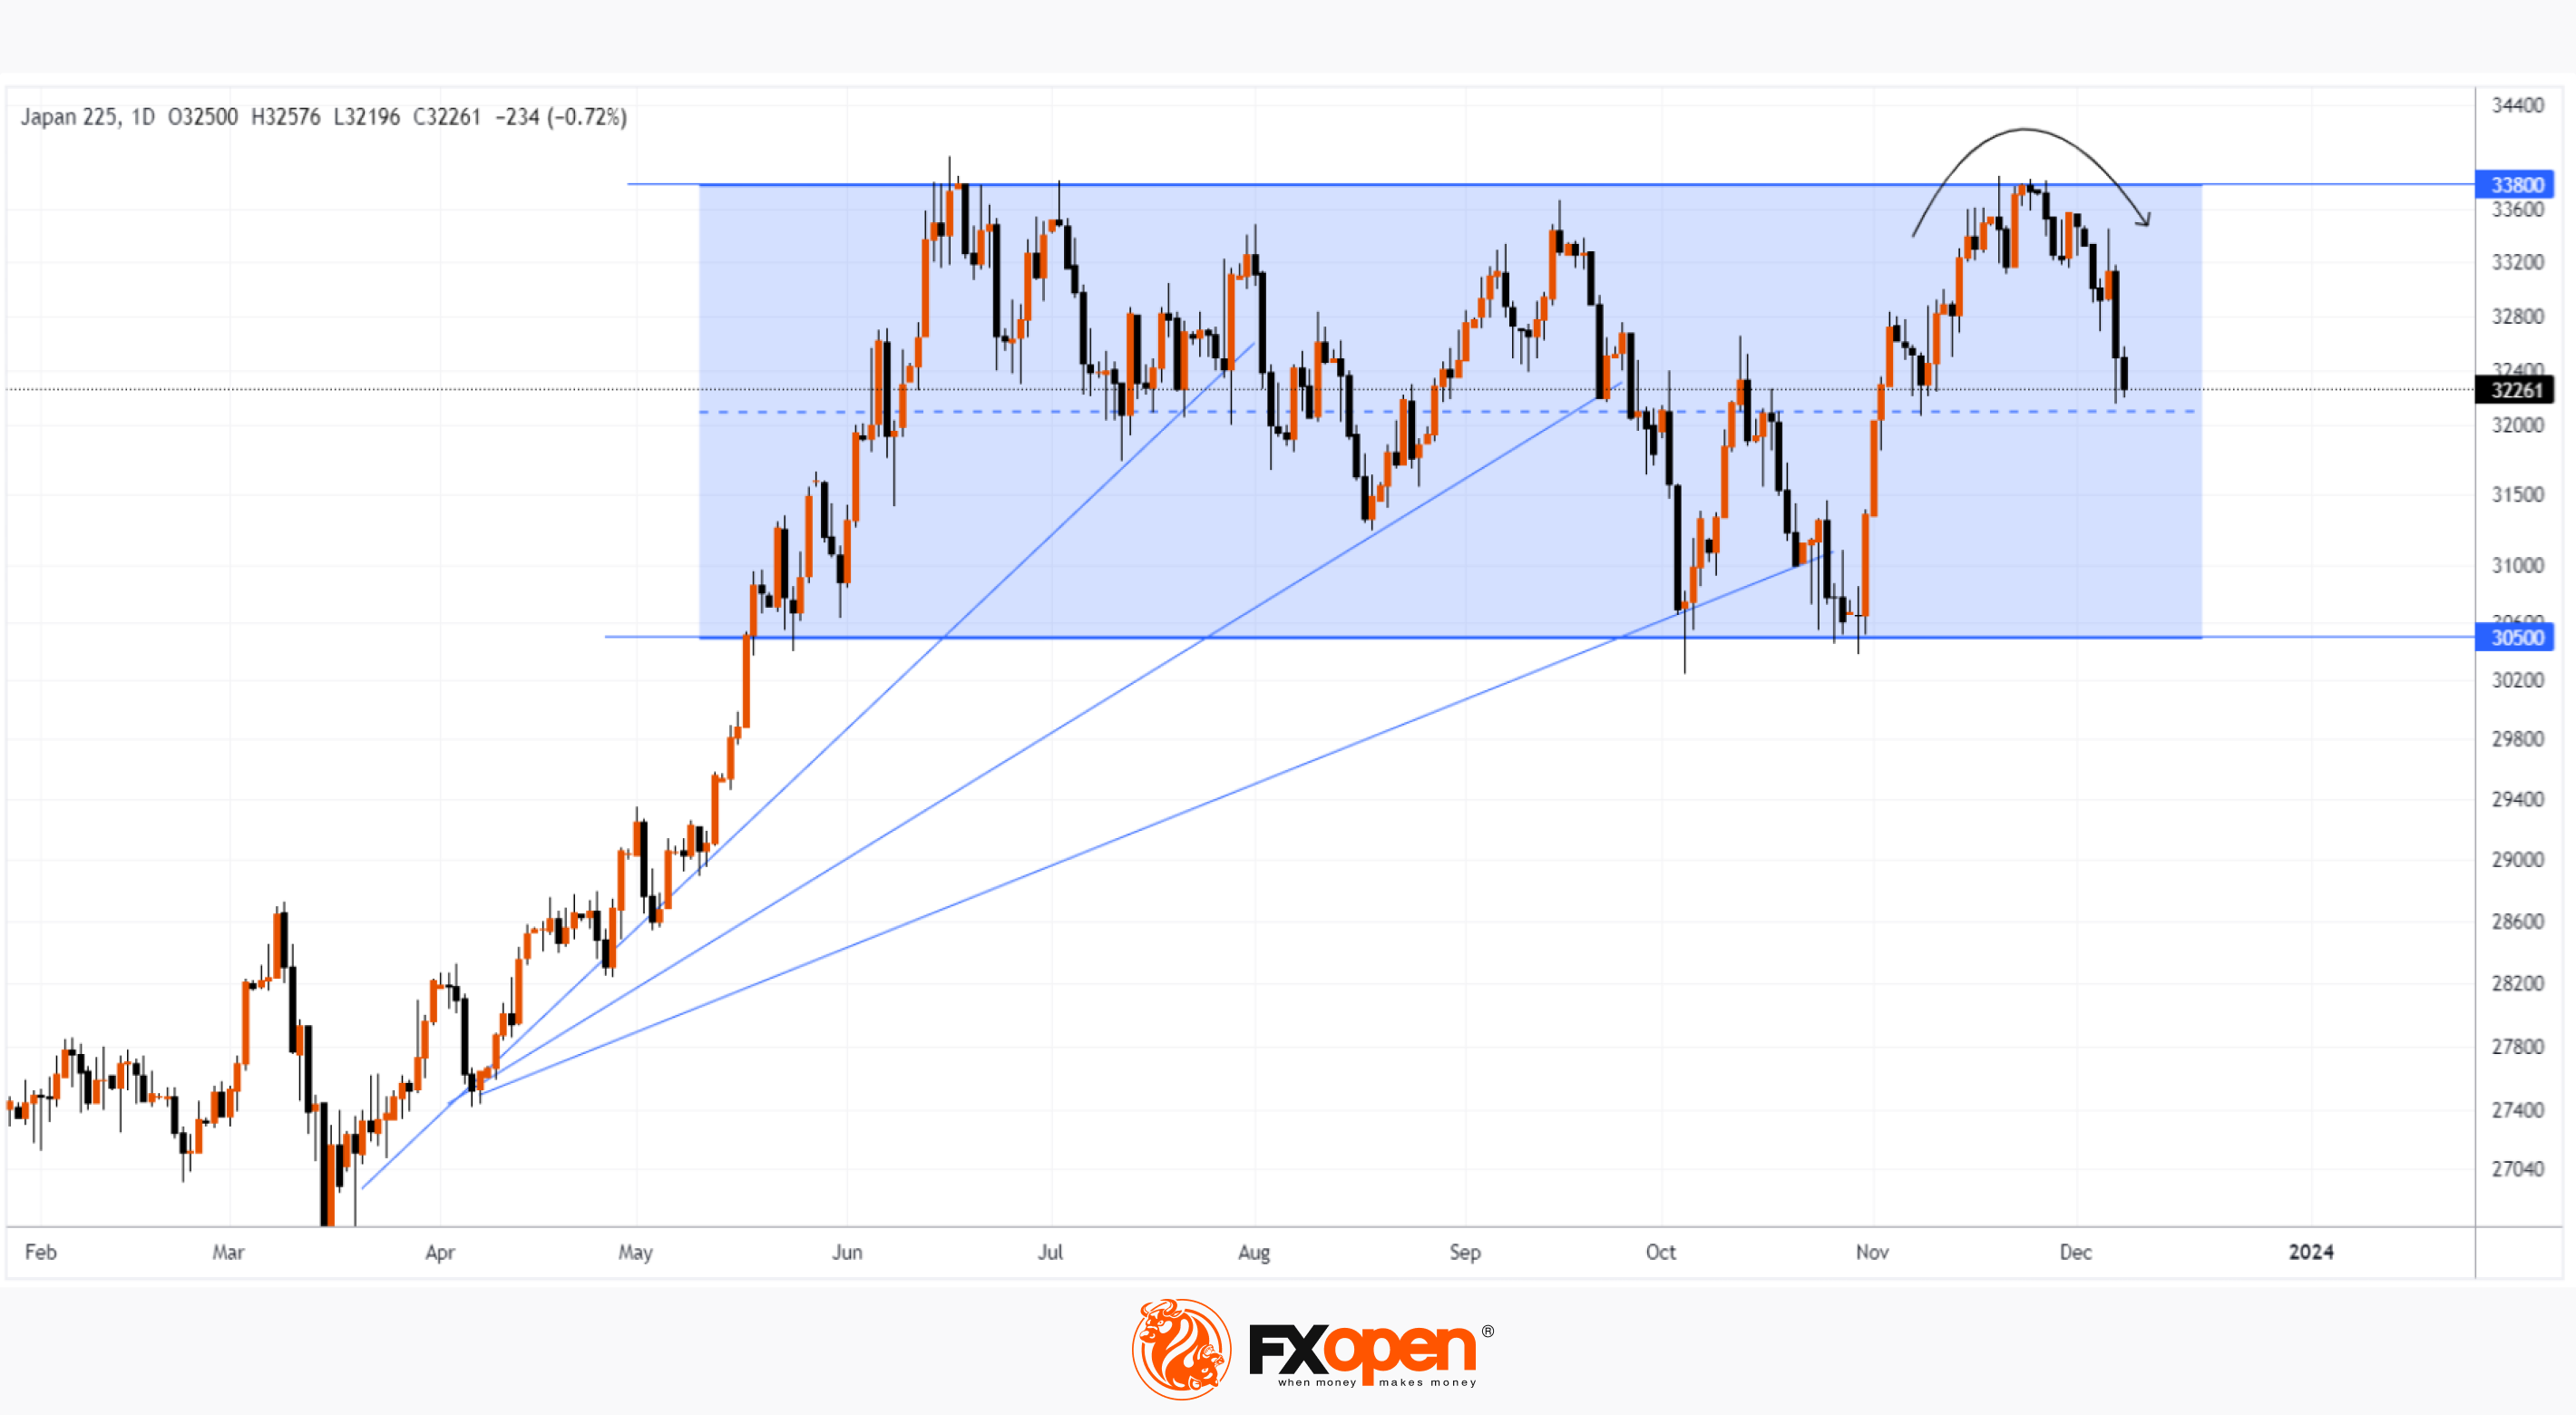
The chart shows that the November top:
→ did not exceed the annual maximum set in June;
→ only slightly exceeded the September high – in fact, a false breakout;
→ the price forms a rounding (shown by an arrow) - a sign of gradual depletion of demand, which is replaced by the dominance of supply.
It is possible that the bears, which are gaining power, will be able to form a breakdown of the median line of the blue channel as early as December.
Trade global index CFDs with zero commission and tight spreads (additional fees may apply). Open your FXOpen account now or learn more about trading index CFDs with FXOpen.
This article represents the opinion of the Companies operating under the FXOpen brand only. It is not to be construed as an offer, solicitation, or recommendation with respect to products and services provided by the Companies operating under the FXOpen brand, nor is it to be considered financial advice.
Stay ahead of the market!
Subscribe now to our mailing list and receive the latest market news and insights delivered directly to your inbox.


Latest articles

AI Valuations Are Back in the Spotlight
Artificial intelligence remains the dominant investment theme of 2026, but investors are increasingly questioning whether AI stock valuations are keeping pace with reality.
💰 Big Tech continues to invest at an unprecedented scale, with hyperscaler AI spending projected to exceed $800

AUD/CAD: Months of Indecision — Is a Breakout Finally Coming?
The Australian dollar has clawed back most of its end-of-June losses, when it touched three-month lows against the greenback amid escalating Middle East tensions. Since then, sentiment has improved: the RBA's Assistant Governor Sarah Hunter signalled the board stands ready

USD/JPY: Battling at the Top of the Triangle
On 3 July, Japan's Finance Minister, Satsuki Katayama, stated that the Ministry of Finance remains in close contact with US authorities regarding developments in USD/JPY as the yen traded near its weakest level in almost 40 years. Similar verbal