FXOpen

Shares of Nvidia are the main newsmakers of the stock market at the beginning of this week. As the chart shows, NVDA opened at USD 403.45 per share on Monday and is trading above USD 440 (over +9%) in premarket Tuesday.
The reasons for this are as follows:
→ analysts at Morgan Stanley confirmed their bullish outlook on the stock;
→ positive expectations from the company's report, which will be published on August 23.
Bullish arguments:
→ support from the psychological level of USD 400;
→ support from the lower line of the ascending channel, active in 2023;
→ a wide bullish candle could be the beginning of a new momentum after a pullback that began in mid-July.
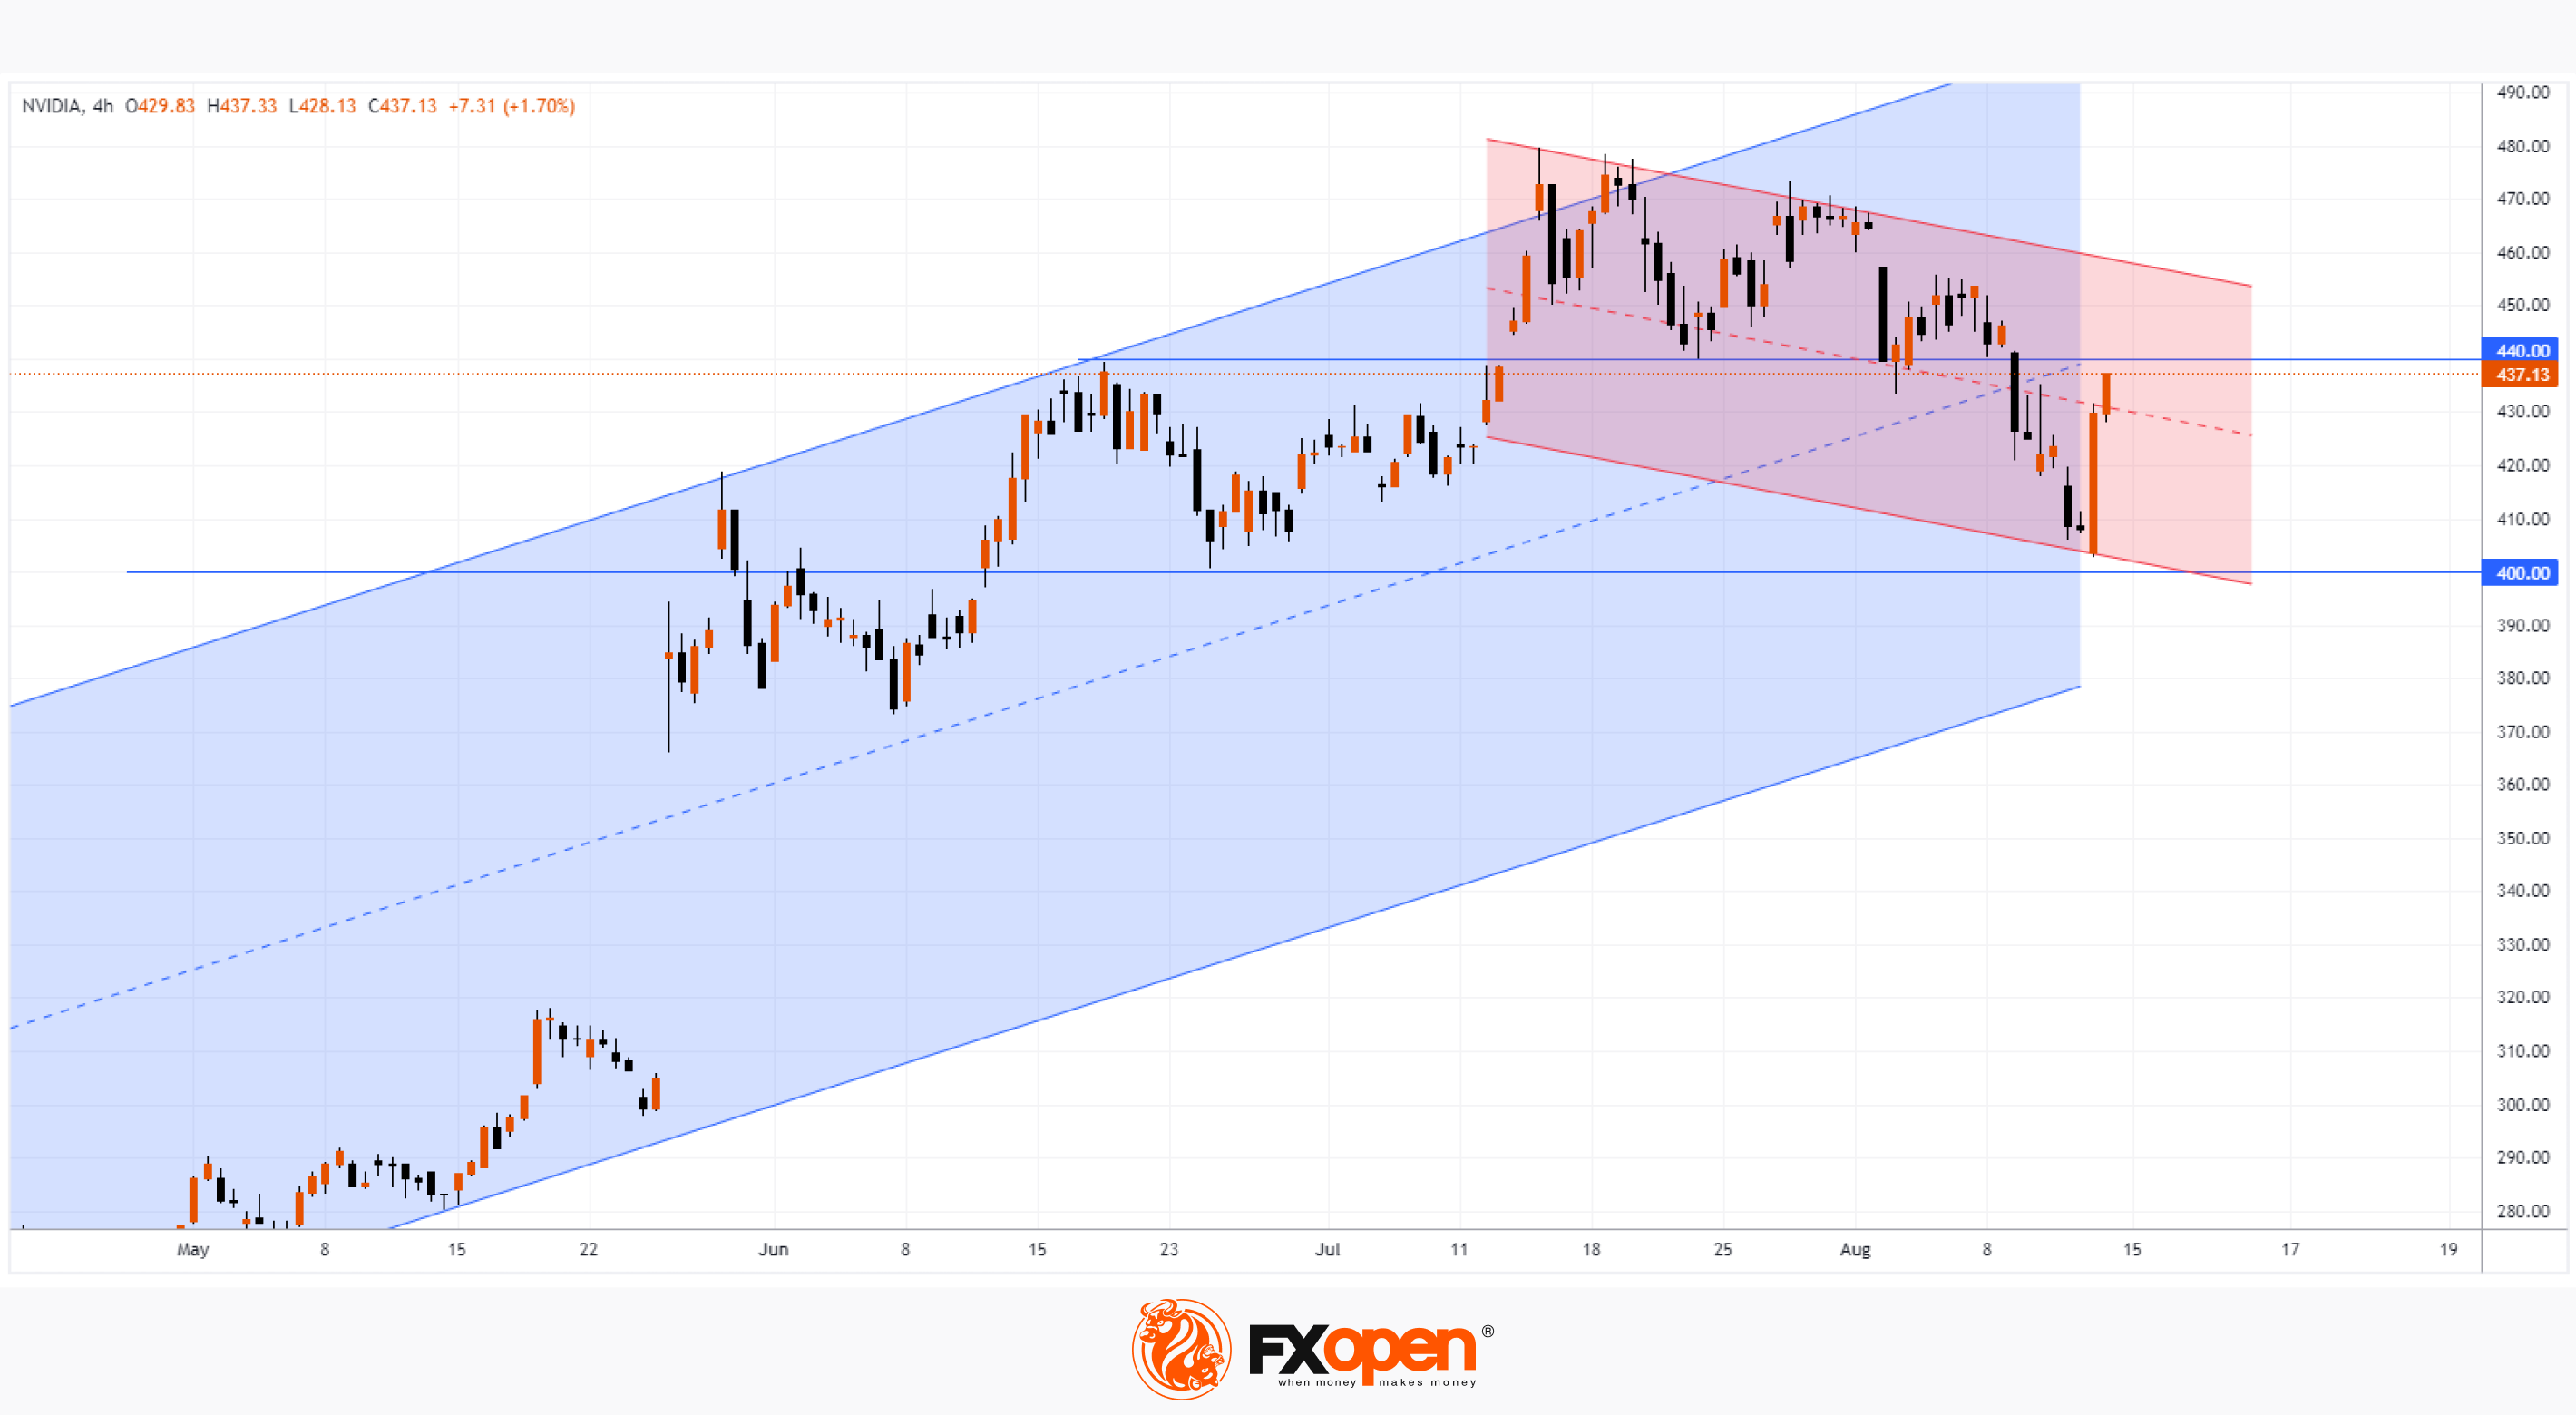
Bearish arguments:
→ the price will have to overcome the upper limit of the descending channel (shown in red), which was formed during the mentioned rollback;
→ The USD 440/NVDA level looks like resistance, as it previously affected the price dynamics. The median line of the blue channel can increase the resistance.
But whatever the technical analysis of the NVDA stock chart, it is reasonable to assume that the August 23rd report will have a decisive impact on the price. It is possible that it can become a cold shower and wash away all the achievements of the bulls in the market, which is experiencing the hype associated with AI.
Buy and sell stocks of the world's biggest publicly-listed companies with CFDs on FXOpen’s trading platform. Open your FXOpen account now or learn more about trading share CFDs with FXOpen.
This article represents the opinion of the Companies operating under the FXOpen brand only. It is not to be construed as an offer, solicitation, or recommendation with respect to products and services provided by the Companies operating under the FXOpen brand, nor is it to be considered financial advice.
Stay ahead of the market!
Subscribe now to our mailing list and receive the latest market news and insights delivered directly to your inbox.


Latest articles

Oracle (ORCL) Shares Jump Above $160
Following a strong earnings report, Oracle shares surged above $160, marking roughly a 1.5-month high:
→ Earnings per share: expected $1.70, actual $1.79;
→ Revenue: expected $16.7bn, actual $17.2bn.
This is the first quarter in 15 years

USD/JPY Approaches Key Resistance Level
The USD/JPY chart shows a bullish trend at the start of March, influenced by the escalation of military activity in the Middle East.
On one hand, the US dollar is strengthening due to increased demand for safe-haven assets. On