


Nvidia and OpenAI Announce Partnership, NVDA Shares Surge
FXOpen
Yesterday it was revealed that leading chipmaker Nvidia and leading artificial intelligence research laboratory OpenAI have announced a strategic partnership, under which Nvidia will invest $100 billion in OpenAI.
A network of data centres will also be created to train and operate the most advanced artificial intelligence models:
→ the network will be based on Nvidia’s next-generation platform, Vera Rubin;
→ the network’s total capacity is unprecedented, reaching 10 gigawatts;
→ the first phase of the project is expected to launch in the second half of 2026.
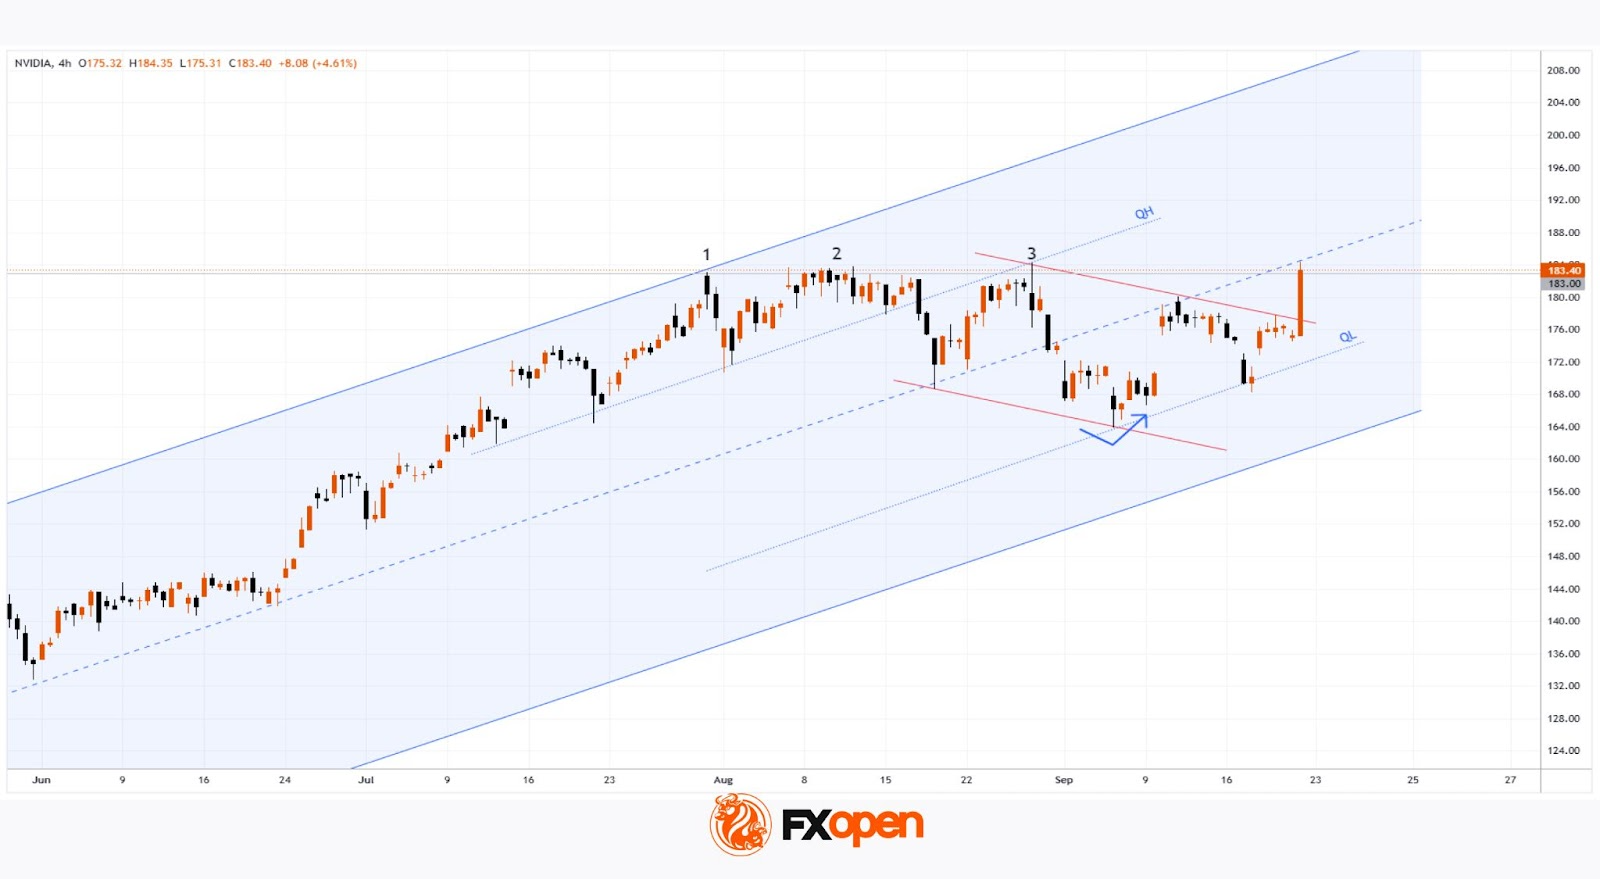
Nvidia (NVDA) shares reacted sharply to the news. During Monday’s trading, 22 September, the company’s stock price jumped by roughly 4%, climbing at yesterday’s high above $184.30 (marking a new all-time record, as shown on the chart). The chipmaker’s market capitalisation closed in on $4.5 trillion, cementing its status as the most valuable company in the world.
Technical Analysis of Nvidia (NVDA) Chart
Previously, in our 1 September analysis of NVDA, we:
→ plotted an ascending channel describing NVDA’s price movements following the bullish impulse at the end of June;
→ noted unsuccessful attempts by the bulls to break resistance at $183, which provided grounds to view the chart in the context of a Triple Top pattern (1-2-3);
→ assumed that the bears were exerting pressure on an overvalued stock and considered a correction scenario.
Since then, the Nvidia stock price corrected to $165, from where it resumed its upward trend (shown with a broken arrow).
The new data provide grounds to:
→ expand the channel (shown in blue) without changing its slope, adding the QH and QL lines to divide the wider channel into quarters;
→ plot the trajectory of the correction (in red).
Within this context, it is reasonable to assume that:
→ the stock price of NVDA found support at the QL line and moved up towards the midline;
→ the red lines form a Bullish Flag pattern;
→ yesterday’s rise broke out of this corrective pattern, with the bulls attempting to resume the upward trend, though the $183 level still provides resistance.
It is not excluded that the strong fundamental background, the development of AI technologies, and the supportive driver of the Fed’s rate cut may ultimately enable the bulls to overcome the $183 level, paving the way for NVDA’s share price to approach the psychological $200 mark.
Buy and sell stocks of the world's biggest publicly-listed companies with CFDs on FXOpen’s trading platform. Open your FXOpen account now or learn more about trading share CFDs with FXOpen.
This article represents the opinion of the Companies operating under the FXOpen brand only. It is not to be construed as an offer, solicitation, or recommendation with respect to products and services provided by the Companies operating under the FXOpen brand, nor is it to be considered financial advice.
Stay ahead of the market!
Subscribe now to our mailing list and receive the latest market news and insights delivered directly to your inbox.


Latest articles

Ethereum: Market Assesses the Strength of the Corrective Recovery
Following a period of heightened volatility in early June, investor attention in Ethereum has once again shifted towards institutional demand and the development of the spot ETF market in the United States. The funds launched last year continue to serve

Ripple: Letter to Congress Stirs the Crypto Market
At the beginning of June, more than 200 crypto companies and industry groups — including Coinbase, Andreessen Horowitz and Ripple Labs — sent a letter to Senate Majority and Minority Leaders John Thune and Chuck Schumer, urging them to bring the Digital

GBP/JPY: Ascending Triangle Under Pressure
The GBP/JPY pair has come under pressure after the Bank of Japan raised its policy rate to 1.0% on 16 June. The Bank of England is following the opposite path: at its 30 April meeting, the Monetary Policy