


FXOpen
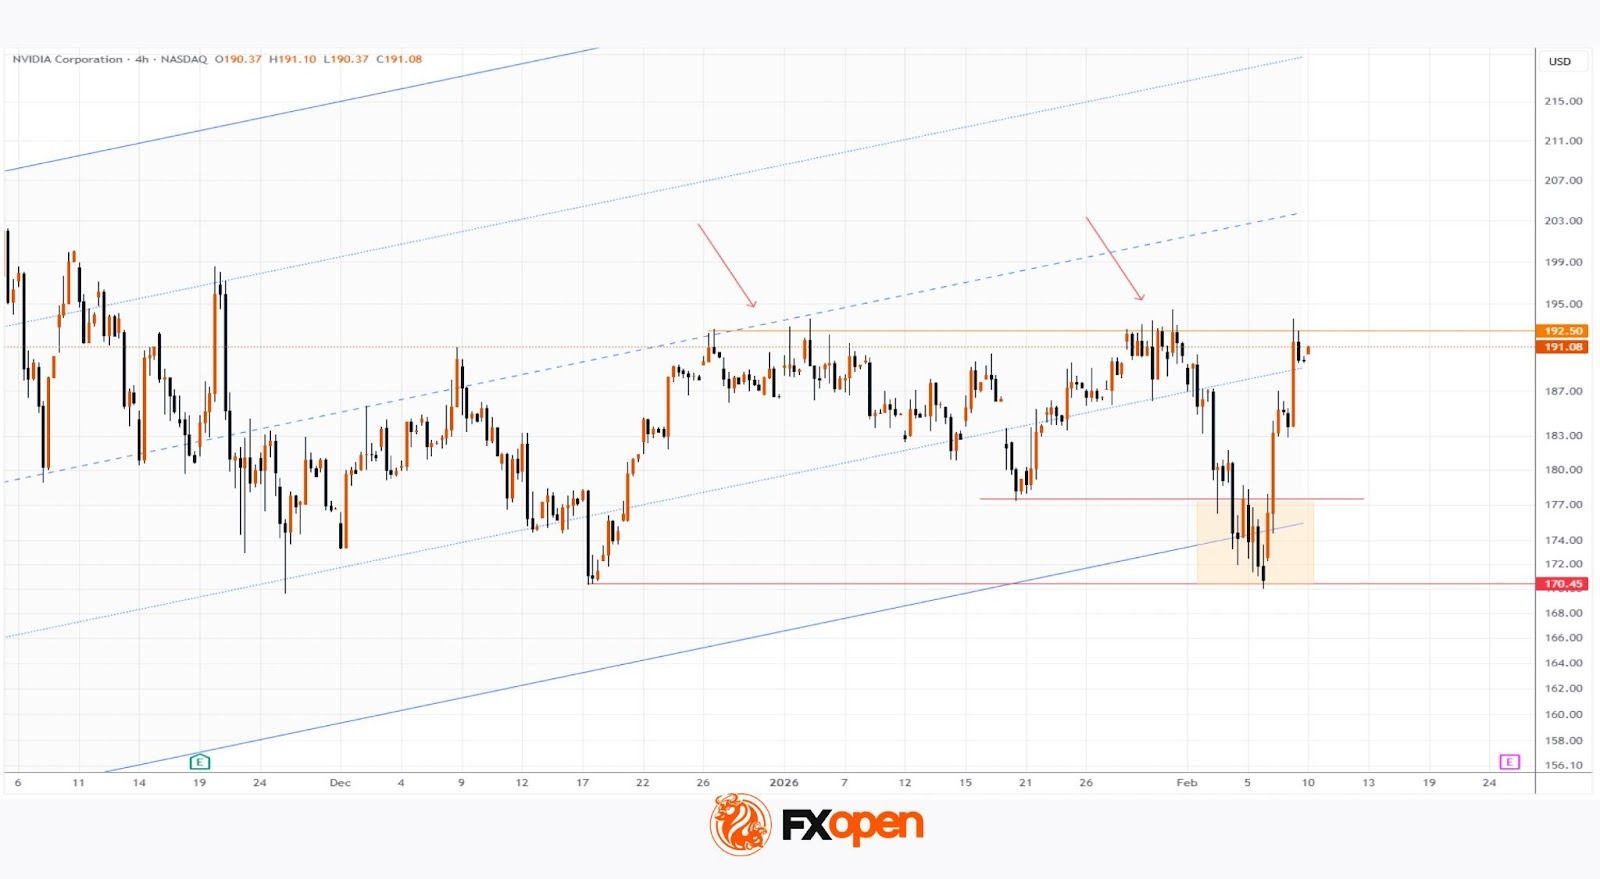
As the Nvidia (NVDA) share chart shows, during yesterday’s trading session the price advanced towards a key resistance area around $192.50, where notable peaks were formed in December 2025 and January 2026. The move was supported by several factors that boosted optimism:
→ Comments from company management. Nvidia CEO Jensen Huang stated that rising spending on AI is justified and reflects a long-term growth phase for the industry.
→ Goldman Sachs analyst Jim Schneider expects Nvidia’s fourth-quarter revenue to exceed forecasts and surpass $67 billion, and also anticipates strong sales and profit figures in the first quarter of the 2026 financial year.
Technical Analysis of the Nvidia (NVDA) Chart
On the morning of 4 February, when analysing NVDA price movements, we:
→ updated the long-term ascending channel, which remains intact;
→ noted the proximity of its lower boundary, which had acted as a key support level for many months;
→ suggested that NVDA’s price could stabilise in the lower quarter of the channel.
Since then:
→ between 4 and 6 February, the price moved sideways near the lower boundary of the channel, reflecting a balance between supply and demand;
→ following a false break below the December low, the share price staged a sharp rebound, signalling the dominance of buying pressure.
It is reasonable to assume that:
→ the initiative is currently on the side of the bulls, who appear determined to resume the long-term upward trend;
→ if another attempt is made to break through the aforementioned resistance level, it is likely to succeed, opening the way for NVDA shares to move towards the psychological $200 mark.
The realisation of this scenario could be supported by positive sentiment ahead of Nvidia’s earnings release on 25 February and the GTC 2025 conference in mid-March, when new product announcements may be made.
Buy and sell stocks of the world's biggest publicly-listed companies with CFDs on FXOpen’s trading platform. Open your FXOpen account now or learn more about trading share CFDs with FXOpen.
This article represents the opinion of the Companies operating under the FXOpen brand only. It is not to be construed as an offer, solicitation, or recommendation with respect to products and services provided by the Companies operating under the FXOpen brand, nor is it to be considered financial advice.
Stay ahead of the market!
Subscribe now to our mailing list and receive the latest market news and insights delivered directly to your inbox.


Latest articles

USD/CAD Rises to a Two-Month High
Today, the USD/CAD currency pair climbed above the 1.3787 level for the first time since late January.
→ Demand for the US dollar is being supported by concerns over escalating tensions in the Middle East. Market participants are favouring

Alphabet (GOOGL) Shares Fall to 2026 Low
As the chart shows, Alphabet (GOOGL) shares have dropped to their lowest level of 2026, with trading closing well below the psychological $300 per share mark.
Why Have Alphabet (GOOGL) Shares Declined?
The bearish move is driven by a combination

FX Market Awaits Macro Data: EUR/USD and GBP/USD Near Range Boundaries
European currencies are trading without a clear direction against the US dollar, remaining in a consolidation phase following the earlier decline driven by USD strength. At the start of the week, both EUR/USD and GBP/USD attempted a recovery,