


FXOpen

Nvidia shares experienced heightened volatility yesterday, with the price jumping to a March high during the Nvidia GTC 2026 conference, where Jensen Huang made several major announcements. According to media reports:
→ Nvidia unveiled a next-generation platform named after the astronomer Vera Rubin. The new chips are designed for “agentic AI” (AI agents).
→ The company expects total orders for current-generation AI systems (Blackwell) and next-generation systems (Vera Rubin) to reach $1 trillion by 2027. This is double the company’s previous $500 billion forecast announced earlier.
→ Huang also noted that market demand is shifting. While chips were previously purchased mainly for training AI models, demand is now increasingly driven by companies such as OpenAI, Meta and Anthropic, which must serve hundreds of millions of users in real time.
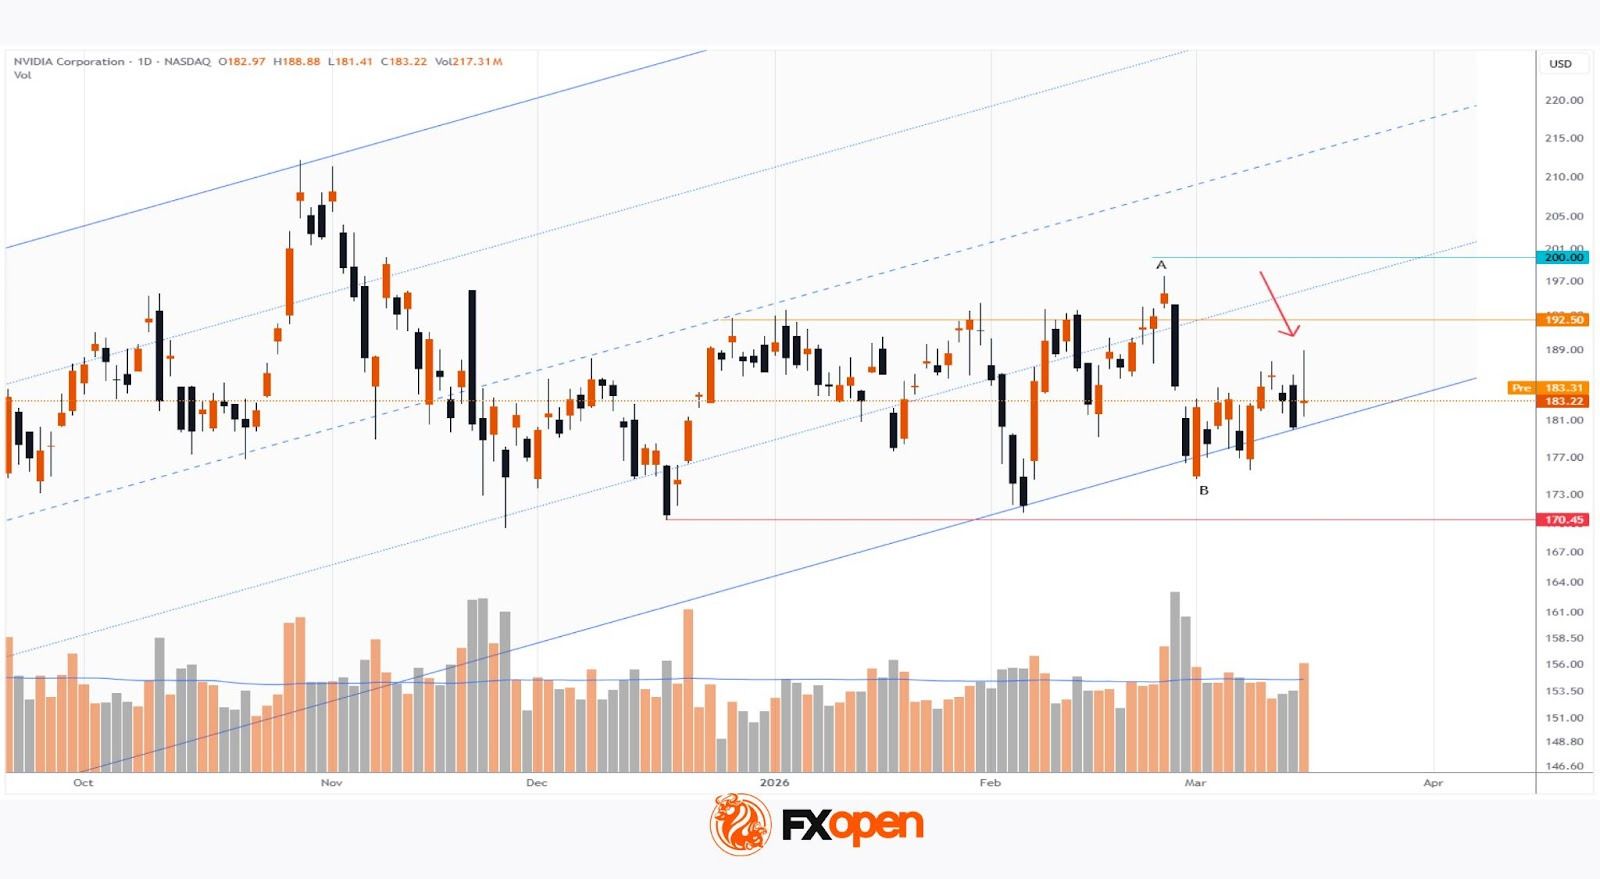
As the NVDA chart shows, the share price rose above the $188.50 level, but later pulled back, which may suggest excessive optimism among buyers and aggressive selling pressure.
Technical Analysis of Nvidia (NVDA)
On the morning of 26 February, while analysing NVDA price movements following the quarterly earnings release, we:
→ updated the long-term ascending channel (which remains intact);
→ pointed to the negative experience of other tech giants earlier in 2026, whose shares rallied briefly after earnings before turning lower (for example, Meta);
→ suggested that if bulls wanted to confirm control of NVDA, it would be important to keep the price above the $192.50 level.
During the main trading session that same day, the $192.50 level was broken by bears on a wide candle accompanied by rising volumes, confirming these concerns. Moreover, the downward momentum continued the following day, eventually leading to the A→B swing.
Overall, bulls still have reasons to remain calm, as:
→ the fundamental backdrop remains optimistic;
→ the lower boundary of the ascending channel continues to act as strong support.
However, the NVDA price chart also presents some warning signs:
→ peak A may represent a bull trap;
→ yesterday’s candle with a long upper shadow could also signal a similar trap.
If this proves to be the case, a test of the lower boundary of the channel would be a logical next step. Such a scenario could significantly alter sentiment in the NVDA stock market.
Buy and sell stocks of the world's biggest publicly-listed companies with CFDs on FXOpen’s trading platform. Open your FXOpen account now or learn more about trading share CFDs with FXOpen.
This article represents the opinion of the Companies operating under the FXOpen brand only. It is not to be construed as an offer, solicitation, or recommendation with respect to products and services provided by the Companies operating under the FXOpen brand, nor is it to be considered financial advice.
Stay ahead of the market!
Subscribe now to our mailing list and receive the latest market news and insights delivered directly to your inbox.


Latest articles

Market Analysis: Gold Price Slips Back, WTI Crude Oil Rally Gains Fresh Strength
Gold price rallied above $4,750 before correcting lower. Crude oil prices are rising and could climb further higher toward $110.00.
Important Takeaways for Gold and WTI Crude Oil Prices Analysis Today
· Gold price gained pace for a move

Consolidation Ahead of NFP: Commodity Currencies Search for Direction
Commodity-linked currencies have entered a consolidation phase following recent directional moves, as market participants adopt a wait-and-see approach ahead of key US labour market data. Current price action reflects a balance between ongoing demand for the US dollar and attempts

The Real Driver Behind the Dollar Rally: Market Insights with Gary Thomson
The US dollar has been firm, but the drivers behind the move may be more complex than they first appear.
While geopolitical tension and shifts in risk sentiment play a role, current price behaviour seems increasingly influenced by inflation expectations