


Nvidia (NVDA) Stock Drops Amid Investigation in China
FXOpen

On 21 November, our analysis of Nvidia (NVDA) stock price revealed:
→ The continuation of a long-term upward channel (illustrated in blue).
→ The significance of resistance at the psychological level of $150.
Since then, NVDA’s stock price has failed to surpass the highlighted resistance level, despite stock indices reaching record highs, indicating Nvidia's relative underperformance compared to the broader market. It seems the AI-driven rally may be losing steam.
Investor concerns were heightened yesterday by news that China has launched an antitrust investigation into Nvidia, suspecting the company of violating the country’s competition laws. In response, Nvidia stated that it complies with its obligations wherever it operates and is ready to cooperate with regulators.
Following this announcement, NVDA’s stock price experienced a modest decline, further reinforcing a bearish outlook.
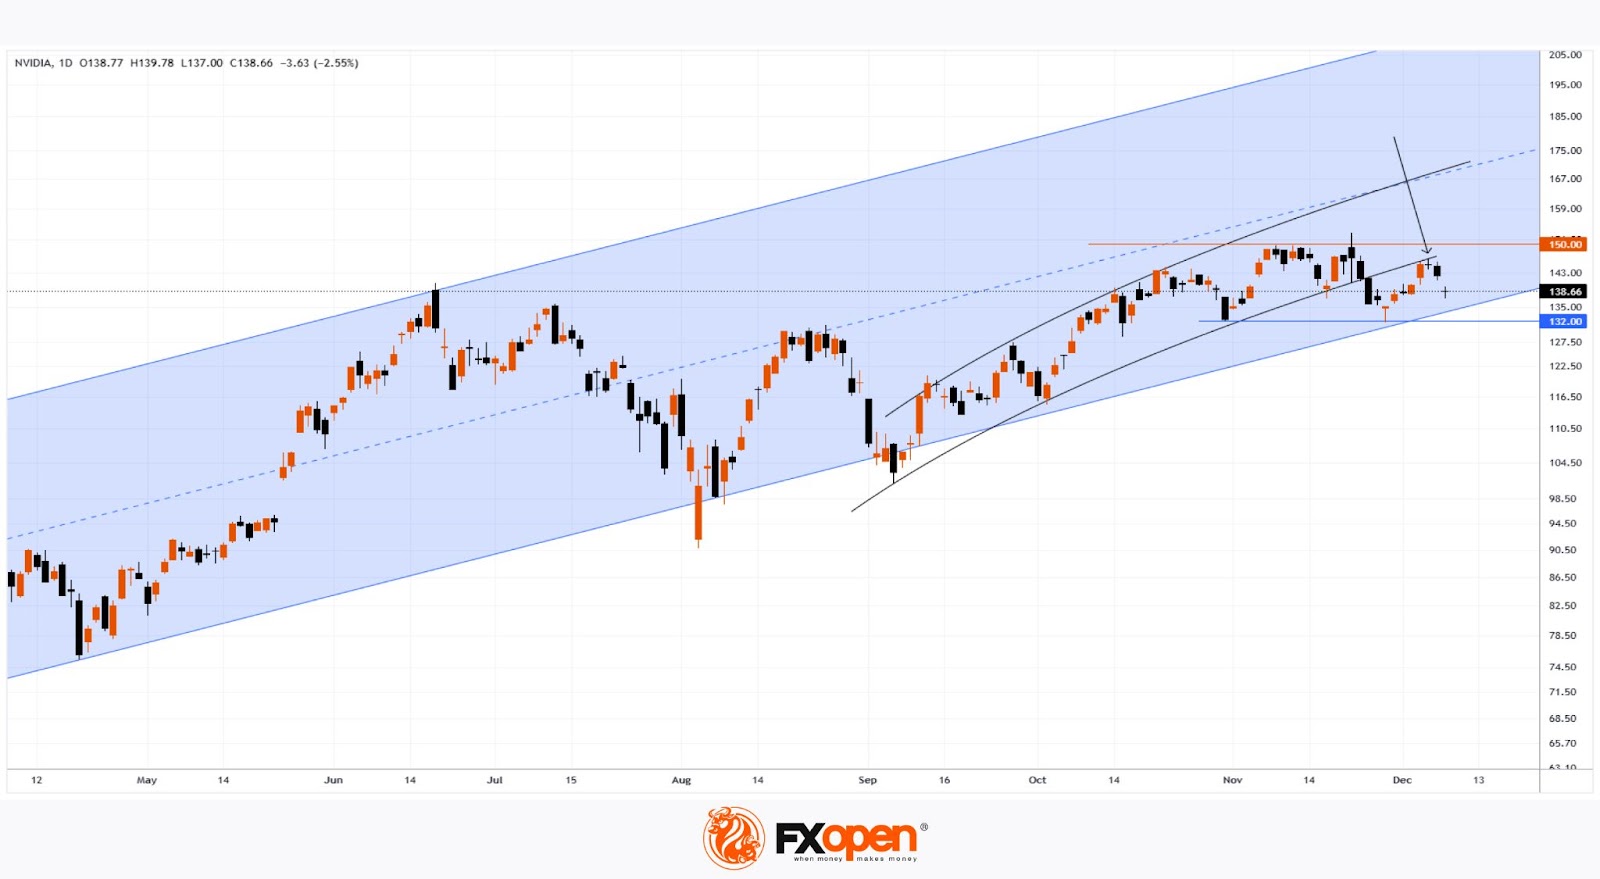
Technical analysis of Nvidia (NVDA) stock chart indicates that if the price fluctuations since September are viewed as forming a channel with curved lines (drawn in black), it becomes evident (as marked by an arrow) that the lower line has shifted its role from support to resistance — a bearish signal.
In this context, the situation appears balanced, with buyers and sellers consolidating NVDA's price within a range of $132 to $150. The eventual breakout from this range could result in a significant swing—but in which direction?
According to TipRanks, analysts remain optimistic:
→ 37 out of 40 analysts recommend buying NVDA stock.
→ The average 12-month price target for NVDA is $176.
Buy and sell stocks of the world's biggest publicly-listed companies with CFDs on FXOpen’s trading platform. Open your FXOpen account now or learn more about trading share CFDs with FXOpen.
This article represents the opinion of the Companies operating under the FXOpen brand only. It is not to be construed as an offer, solicitation, or recommendation with respect to products and services provided by the Companies operating under the FXOpen brand, nor is it to be considered financial advice.
Stay ahead of the market!
Subscribe now to our mailing list and receive the latest market news and insights delivered directly to your inbox.


Latest articles

AUD/CAD: Months of Indecision — Is a Breakout Finally Coming?
The Australian dollar has clawed back most of its end-of-June losses, when it touched three-month lows against the greenback amid escalating Middle East tensions. Since then, sentiment has improved: the RBA's Assistant Governor Sarah Hunter signalled the board stands ready

USD/JPY: Battling at the Top of the Triangle
On 3 July, Japan's Finance Minister, Satsuki Katayama, stated that the Ministry of Finance remains in close contact with US authorities regarding developments in USD/JPY as the yen traded near its weakest level in almost 40 years. Similar verbal

Dow Jones (DJIA): Consolidation Beyond the Trend
Federal Reserve Chair Kevin Warsh testified before Congress on 14–15 July, reaffirming the Fed's commitment to bringing inflation back to target while providing no clear guidance on the future path of interest rates. Meanwhile, June inflation data came in